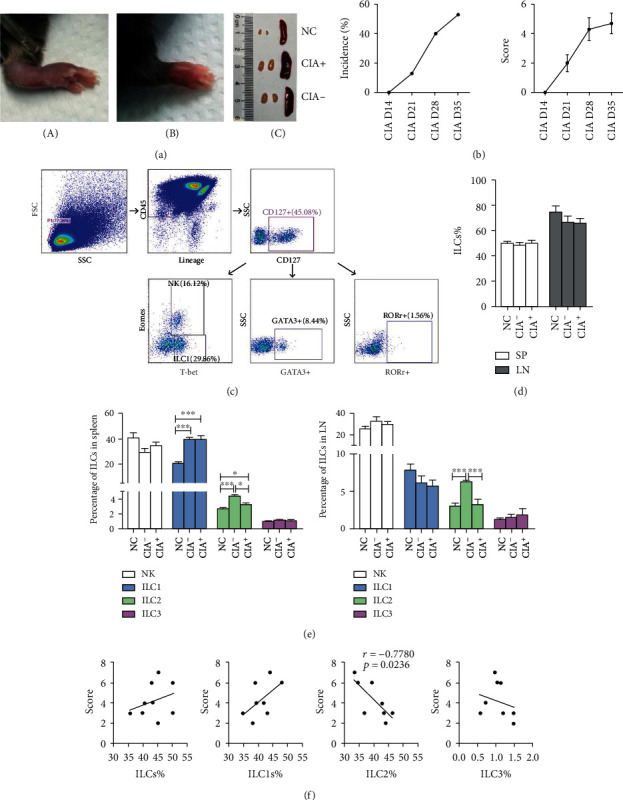
Figure 3.

ILC subsets in mice with CIA and NCs. (a) Redness and swelling of paws after immunization (A, B). Lymph nodes and spleens that were obviously enlarged (C). NC: negative control; CIA−: immunized mice without arthritis; CIA+: immunized mice with arthritis. (b) The incidence and disease scores of CIA mice. A total of 17 mice received immunization, and 9 developed arthritis at week-5. (c) Gating strategy for total ILCs (CD45+ Lineage-CD127+), NK cells (T-bet+Eomes+), ILC1s (T-bet+Eomes-), ILC2s (GATA3+) and ILC3s (RORγ+). (d, e) Proportion of total ILCs, NK cells, ILC1s, ILC2s, and ILC3s in the spleens and lymphoid nodes of mice with CIA and NCs. NC, n = 5; CIA−, n = 5; and CIA+, n = 9. (f) Correlation of the proportion of ILC subsets in the spleen with disease score at week-5. NC: negative control; CIA: collagen-induced arthritis; SP: spleen; LN: lymph nodes. Data are expressed as means ± SDs and analyzed using the unpaired Student's t-test. Spearman's rank correlation coefficients and p values are indicated. ∗p < 0.05, ∗∗∗p < 0.001.
