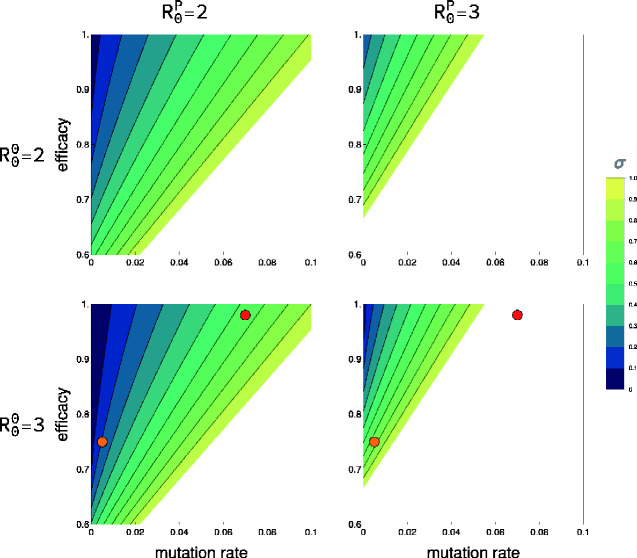
Figure 3.
The direct vaccination effort (σ) necessary for prophylaxis based on mutation rate and efficacy. Rows represent the of the vector used to create the vaccine, and columns represent the of the pathogen targeted by the vaccine. The x-axis represents the rate of antigen mutational degradation. The y-axis reflects the efficacy of the vaccine. In all cases, the transmission cost imposed on the vaccine from expressing the antigen was zero. Results were generated assuming identical transmission and recovery rates between the functional and degraded vaccine strains which differed only in their efficacy. The filled circles represent two alternative vaccine candidates. The blank regions in the subplots define areas of parameter space where a pathogen of the given can always invade due to incomplete vaccine efficacy even if all individuals are directly vaccinated at birth.

