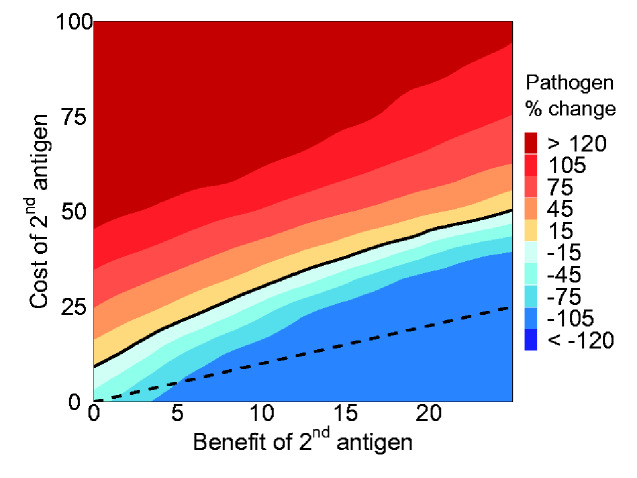
Figure 7.
The average percent change in the number of individuals infected with the pathogen between a vaccine with either one or two antigens after 2,000 days across 100 replicate trials. The x-axis shows the benefit of adding a second antigen as a percent increase in efficacy (ξ). The y-axis shows the cost, or reduction in transmission, resulting from adding a second antigen with a value of 100 per cent representing a vaccine incapable of transmission. The black solid line denotes parameter combinations where a second antigen has no effect on the final frequency of the pathogen. This line does not intersect (0,0) due to the indirect benefit of evolutionary stability afforded by genetic redundancy in the two-antigen vaccine. The black dashed line reflects the 1:1 cost to benefit boundary.

