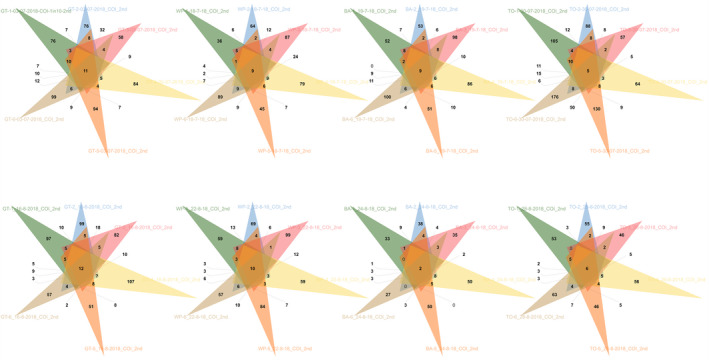
FIGURE 3.

Number of BINs identified per trap and overlapping BINs. Each colored triangle represents one of six traps per location (Halton Hills [GT], Chatham‐Kent [WP], Barrie [BA], and Woodstock [TO]) and date sampled in July and August 2018. The number of overlapping BINs among traps per location and date is indicated in the intercepting area for each representation
