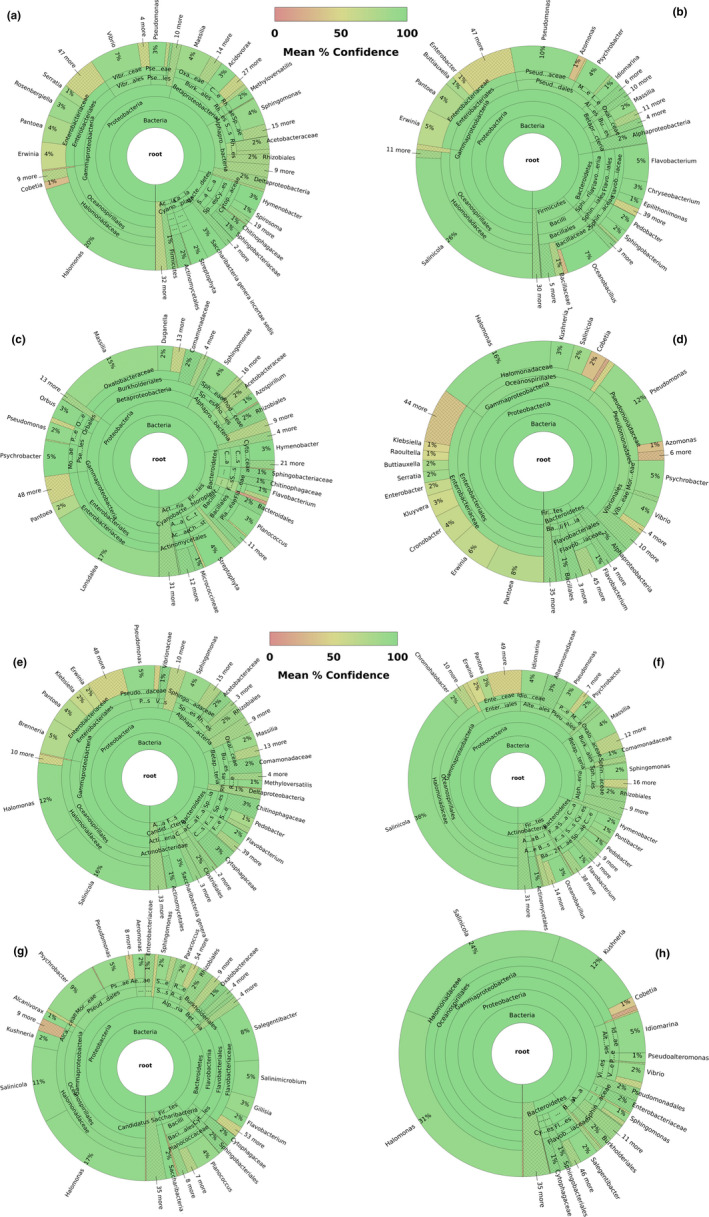
FIGURE 4.

Graph representing bacterial diversity per sampling location and collection date. The color gradient represents mean confidence, as indicated in the gradient bar. An interactive pie chart showing the classification of the sequences and including detailed information for each section of the pie can be viewed online. The list of links per collection sites is indicated below. a: GT 3‐7‐2018 (https://16s.geneious.com/16s/results/fa8ab1e3‐4f50‐4985‐ac59‐7302a31b8451.html); b: wp 18‐7‐2018 (https://16s.geneious.com/16s/results/e7d15b36‐86bd‐493f‐8ccf‐36ac439842c3.html#); c: ba 19‐7‐2018 (https://16s.geneious.com/16s/results/57cc0b9e‐f720‐4476‐9afb‐897e7fcb89fd.html); d: to 30‐7‐2018 (https://16s.geneious.com/16s/results/12fee165‐8bf0‐409f‐adb3‐3501ece47a8d.html#); e: gt 16‐8‐2018 (https://16s.geneious.com/16s/results/386dbe57‐590b‐44ef‐89f6‐f068d64dabff.html#); f: wp 22‐8‐2018 (https://16s.geneious.com/16s/results/a2631a48‐9dd8‐4c6a‐9358‐8f357f012baa.html#); g: ba 24‐8‐2018 (https://16s.geneious.com/16s/results/2dd31759‐6c6c‐458a‐bcc7‐0478626d21d9.html#); h: to 28‐8‐2018 (https://16s.geneious.com/16s/results/f30255aa‐9f0c‐4e4d‐95f1‐8d782cef0f6b.html#)
