FIGURE 5.

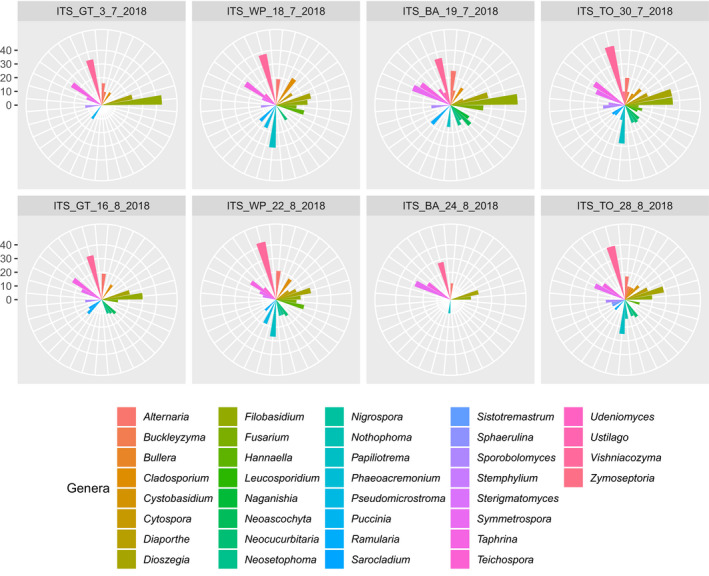
Graphical representation of the fungal genera with ten or more species per sampling location and date. Each genus is represented by a different color, and the scale represents the number of species found

Graphical representation of the fungal genera with ten or more species per sampling location and date. Each genus is represented by a different color, and the scale represents the number of species found