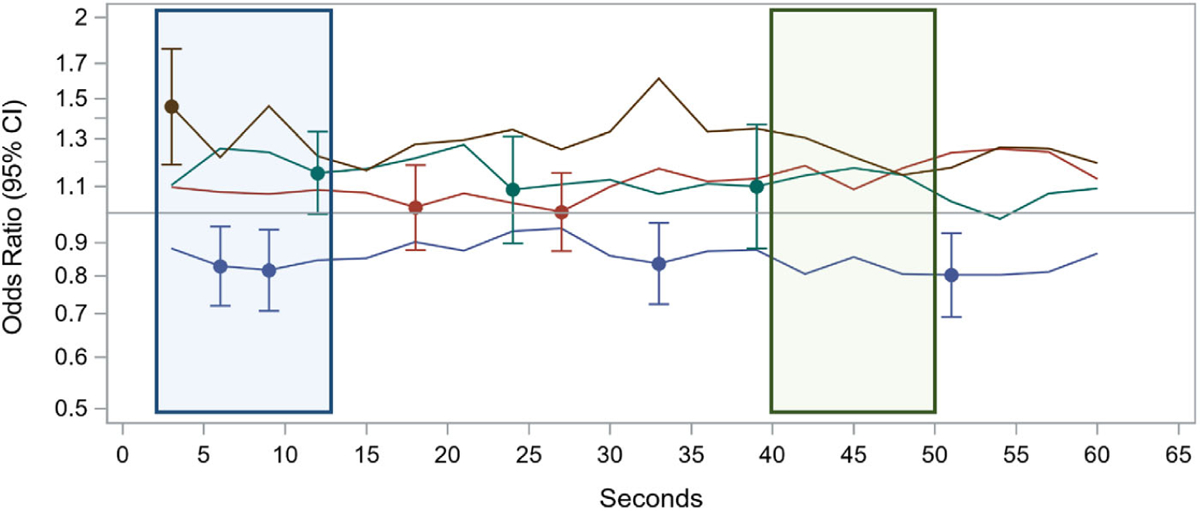
Figure 2.

Time series of odds ratios for the association between the mean expression probability or proportion attending and ASD diagnosis. Using the “Rhymes” movie as one illustrative example, lines depict the odds of meeting criteria for ASD (OR > 1) or being in the non-ASD comparison group (OR < 1) for each of the outcomes of interest for each 3 sec time bin across the movie. Points with error bars are intervals that were selected by the LASSO regression models and included in the final logistic model. The blue window depicts a segment of the movie where there were differential emotional responses between the ASD and non-ASD children. The green window depicts a segment of the movie in which there was no difference in emotional responses between the groups.
