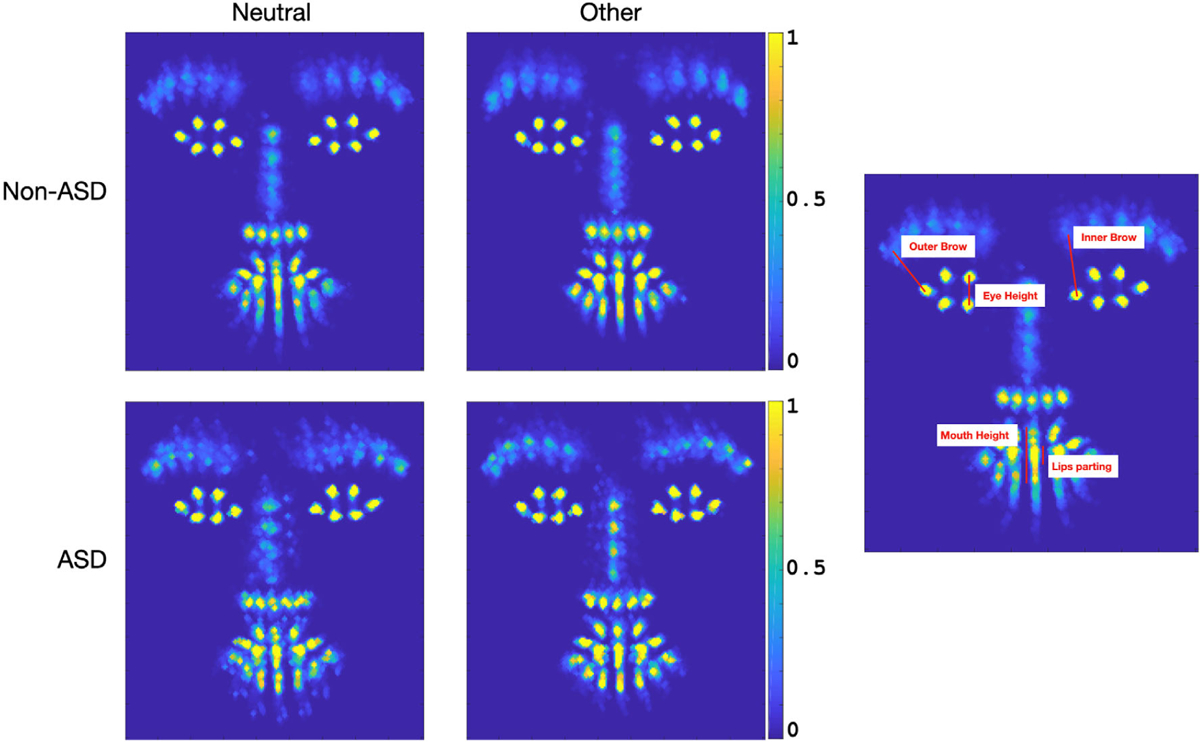
Figure 4.

Analysis of Other Facial Expression. The 4 panels on the left depict heat maps of aligned landmarks across ASD and non-ASD participants when they were exhibiting Neutral and other facial expressions (the color bar indicates proportion of frames where landmarks were displayed in a given image location). The single panel on the right is an example of the landmark distances explored.
