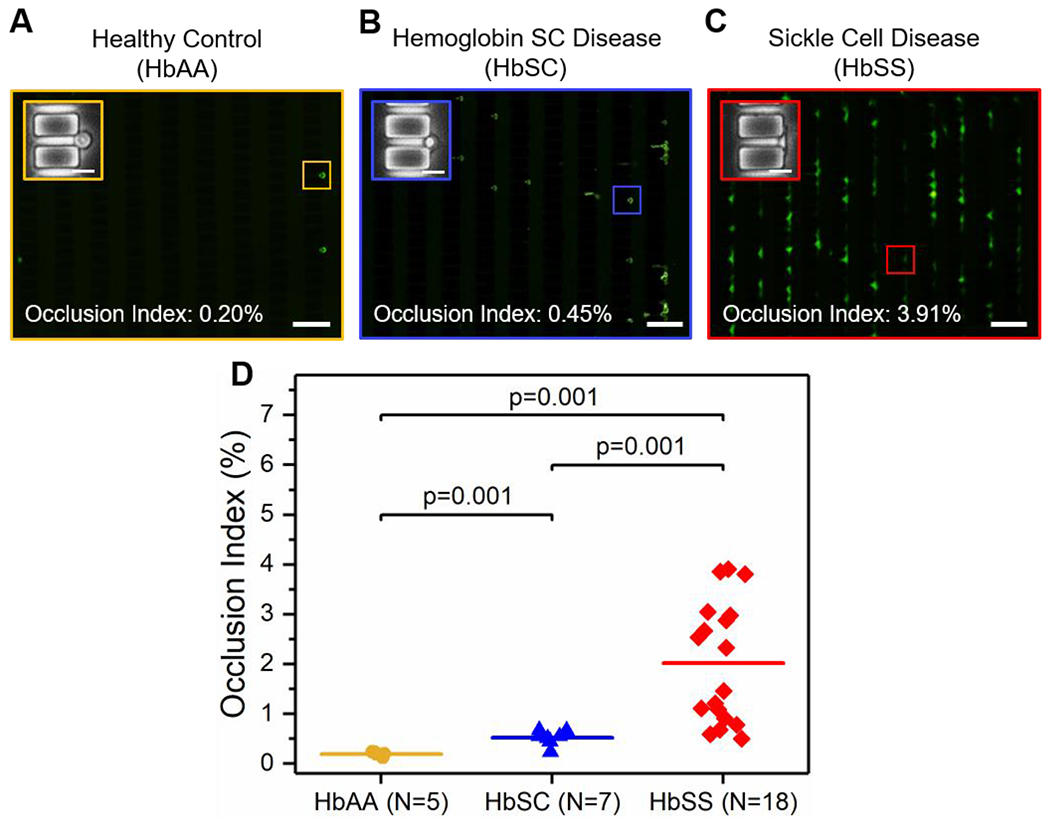
Figure 2. Standardized microfluidic assessment of RBC mediated microvascular occlusion reveals a clinically diverse population in subjects with SCD.

Representative fluorescent microscopy images showing retained RBCs from: (A) healthy individuals (HbAA), (B) subjects with HbSC, and (C) subjects with HbSS. Insets are close-up phase-contrast images showing individual retained cells in 4 μm microcapillaries. Values correspond to the Occlusion Indices of the three shown subjects. Scale bars represent 50 μm and 10 μm, respectively. (D) The Occlusion Index of HbSS RBCs is significantly higher than that of HbSC RBCs or HbAA RBCs, and the OI of HbSC RBCs are significantly higher than that of HbAA RBCs. Colored horizontal lines represent mean of data set. Statistical significance between groups defined by Mann-Whitney U test (P < 0.05).
