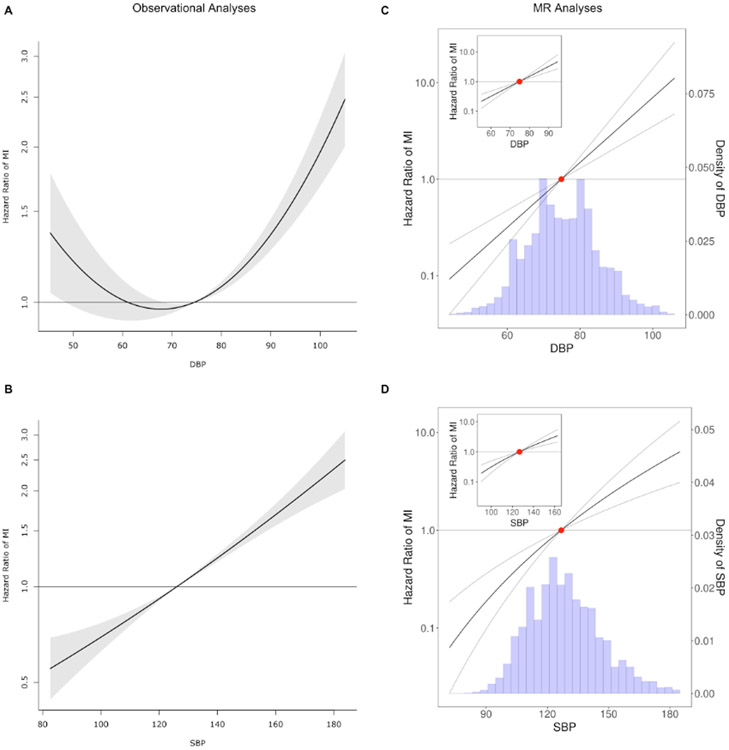
Figure 1.
Analysis of the shape of the relationship between blood pressure and cardiovascular outcomes. A. Shape of the relationship between diastolic blood pressure and myocardial infarction based on observational data that reveal a U- or J-curve. B. Shape of the relationship between systolic blood pressure and myocardial infarction. C. Shape of the genetic relationship between diastolic blood pressure and myocardial infarction based on the fractional polynomial non-linear MR approach. D. Shape of the genetic relationship between systolic blood pressure and myocardial infarction based on the fractional polynomial non-linear MR approach. The hazard ratio of the mean DBP (panel C) or mean SBP (panel D) is centered at 1 (red dot). Note that the hazard ratios presented in the MR figures represent a meta-regression of hazard ratios for each quantile of BP compared to the mean BP in an effort to approximate hazard ratio per unit increase in the exposure. The y-axes are in log-scale.

