Figure 3.
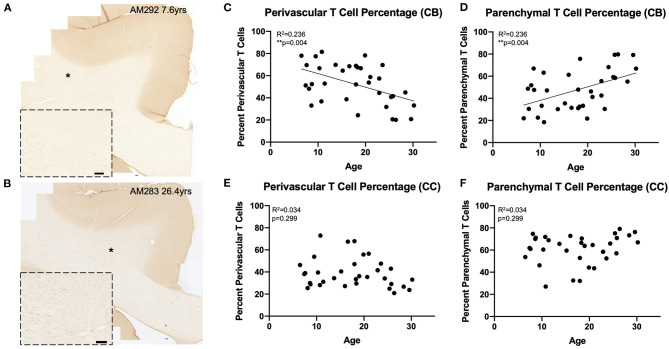
Greater proportion of T cells in the white matter parenchyma with age: (A,B) Representative region of interest images for CD3+ stained T cells in a young (A) and old (B) monkey. Inset shows detail, location of inset marked with * in large image. Scale bars are 100 μm. (C,D) The percentage of perivascular T cells decreases while the percentage in the parenchyma increases with age in the cingulum bundle; (E,F) The percentage of perivascular T cells as well as those in the parenchyma does not change with age in the corpus callosum. CB, cingulum bundle; CC, corpus callosum. N = 34.

