
Figure 2:
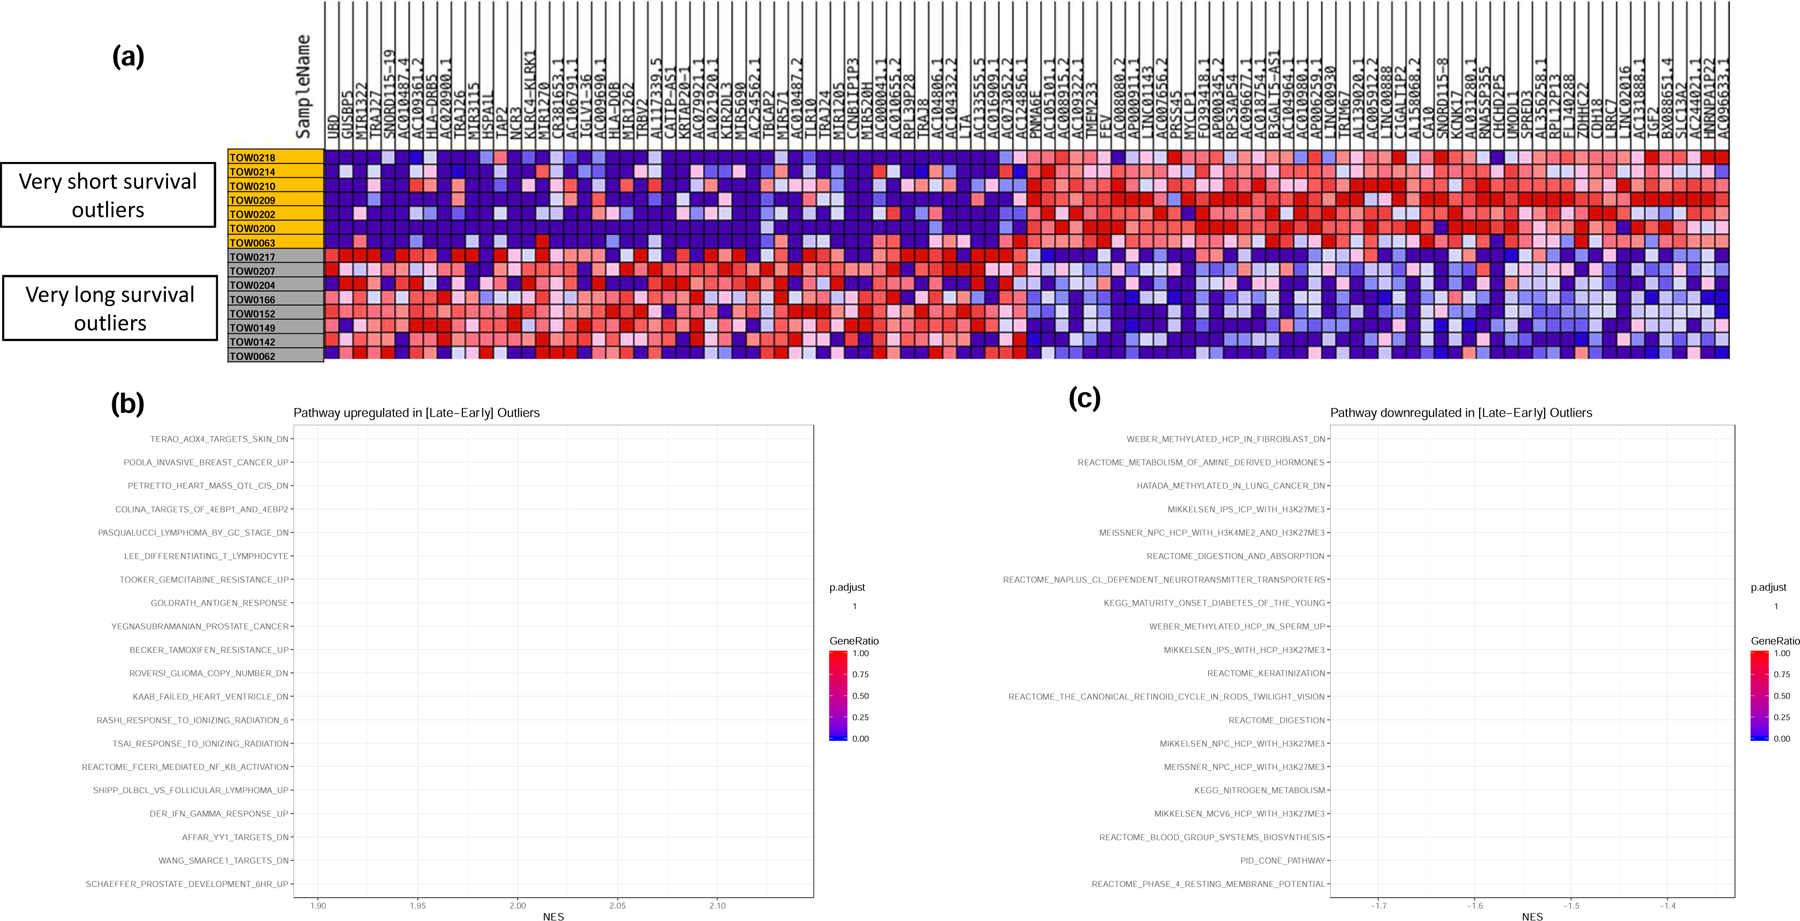
GSEA for differentially regulated pathways between matched survival outliers (i.e. patients within the top and bottom deciles of the OS curves matched for key prognostic factors of gender, age and treatment). a). heatmap of differentially expressed genes in tumor samples from the matched outliers. b). Top 20 up-regulated pathways in very long survival outliers over very short survival outliers. Note that IFN-γ response genes were significantly upregulated in late survivors. c). Top 20 down-regulated pathways in very long survival outliers over very short survival outliers.