
Figure 6:
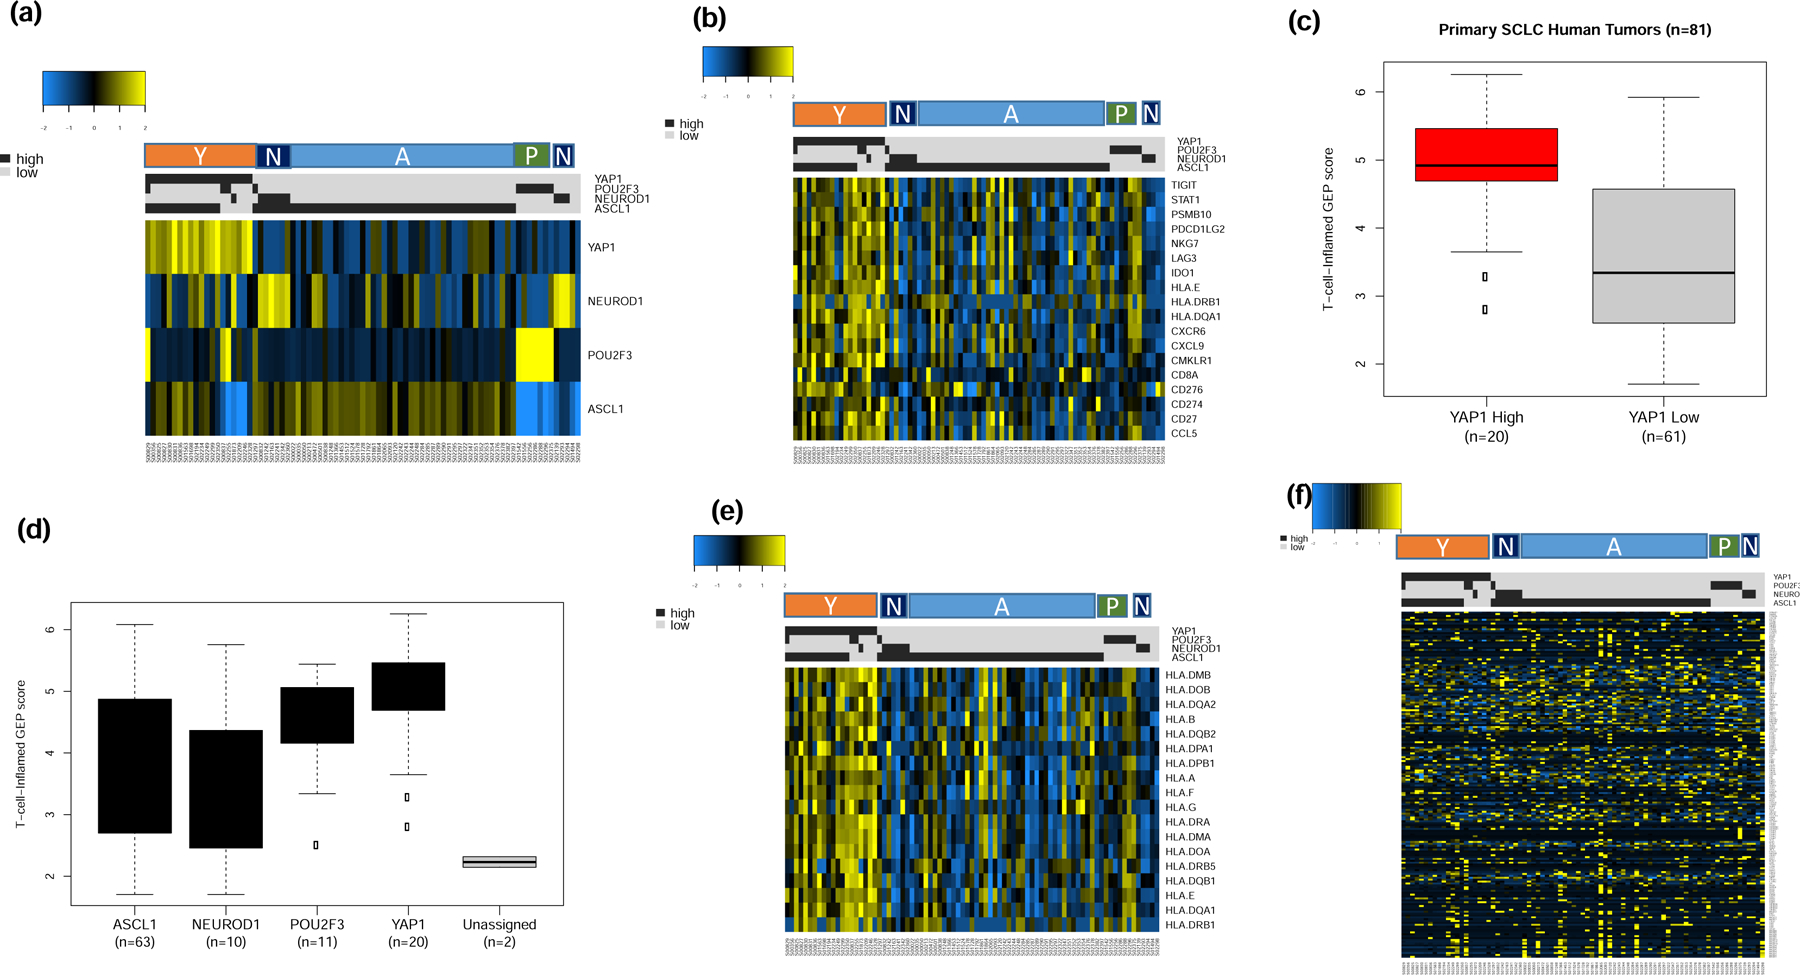
Supervised analysis of publicly available expression dataset from 81 primary tumor samples by SCLC subtypes (A, N, P and Y) as a validation step. a). The tumor samples were classified into one of four subtypes with the vast majority being of the SCLC-A subtype; cases with concomitant expression of two lineage markers were classified based on the marker with dominant expression; b). The highest expression of 18 IFN-γ related genes cells was observed in the SCLC-Y subtype; c). T-cell-inflamed GEP score was higher in YAP-1 expressing tumors; note that cases with concurrent expression of YAP-1 and ASCL-1 were classified as YAP1 positive due to the extreme dominance of YAP1 expression in these tumors; d). overall trend of T-cell-inflamed GEP score was consistent with the findings in the discovery dataset and cell line datasets whereby SCLC-Y had the highest score followed by SCLC-P while SCLC-A and SCLC-N had the lowest GEP score (right panel); e). HLA gene expression analysis with the highest expression in SCLC-Y followed by SCLC-P subtypes and negligible expression in SCLC-N and SCLC-A subtypes similar to the result from the initial analysis in the discovery dataset; f). Supervised analysis showed no differential expression patterns for CTA genes between the four SCLC subtypes.