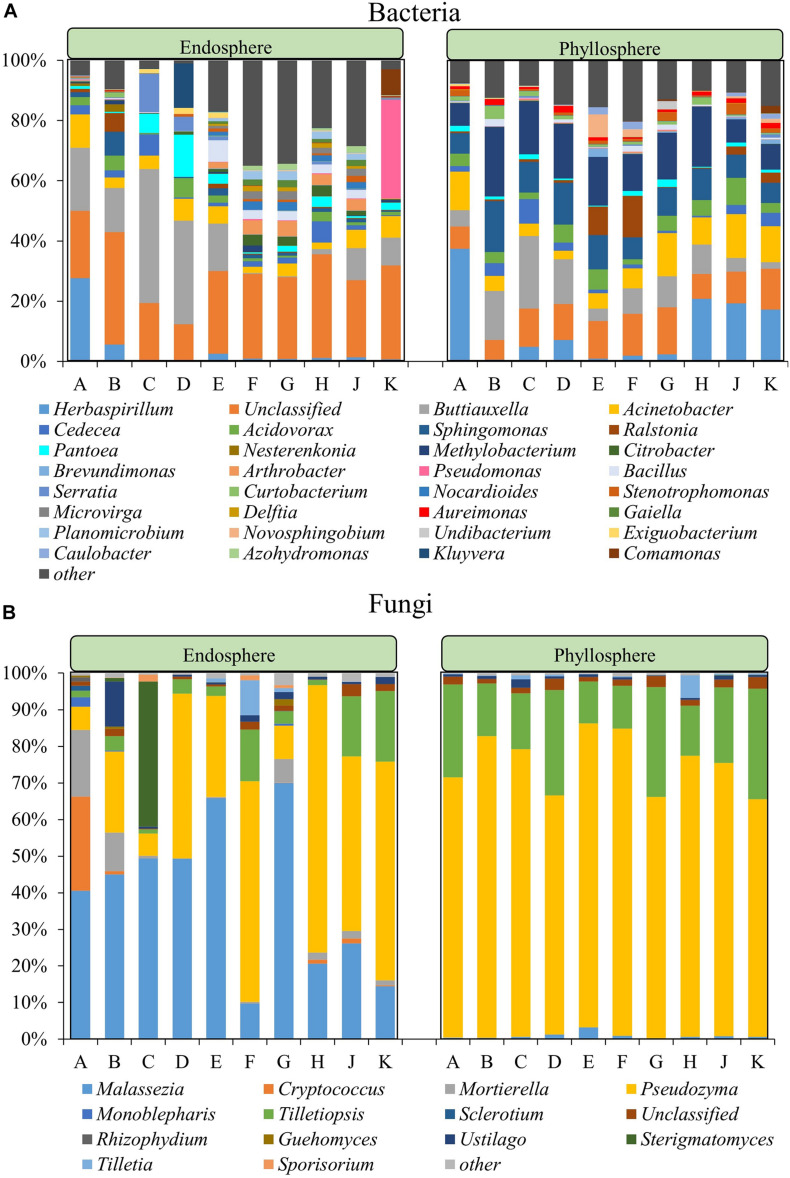
FIGURE 2.
Community composition within the bacterial (A) and fungal (B) community at genus level. For both communities the phyllosphere and the endosphere are separately shown. The fraction labeled with “other” represents the sum of all microorganisms with a relative abundance <2% in all community types.

