FIGURE 7.
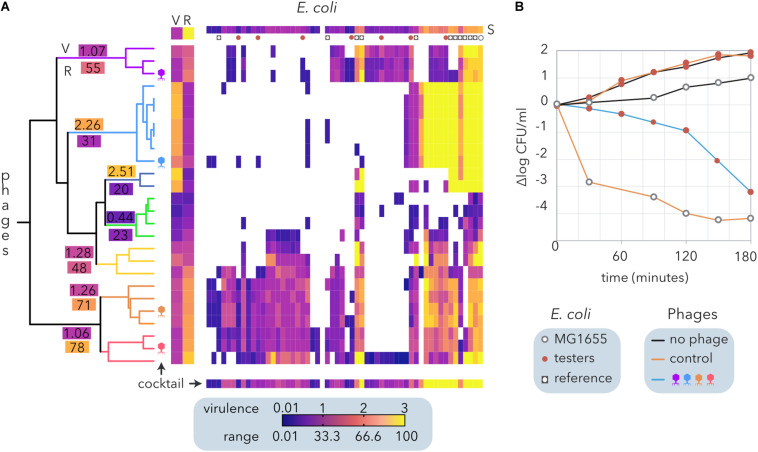
Design and evaluation of a phage cocktail for biocontrol of E. coli isolated from small ruminant raw milk cheeses. (A) Hierarchical clustering of an E. coli and coliphage matrix (Figure 2B) by Ward’s method. Each phage-host interaction was analyzed several times (6 > N > 2), and the average virulence (growth inhibition) is represented by the clearing intensity (0 = no lysis, 3 = complete lysis) of cross-streaks (Molina et al., 2020). The host range (R) and the average virulence (V) for each phage and the average susceptibility of each host strain to phages are shown (S). The clusters of phages are indicated by branch coloring in the dendrogram. The average virulence (V) and host range (R) values are shown for each cluster. The phages selected for the cocktail are schematically depicted. The expected virulence of the cocktail for each bacterial strain is shown at the bottom. Reference E. coli and the strains selected to test the phage cocktail are represented as indicated in the legend. (B) Evaluation of growth inhibition by the phage cocktails. The reference E. coli strain MG1655 and seven cheese-isolated E. coli strains with different proteomic (Molina et al., 2020) and phage sensitivity profiles (A) were used as controls. Two cocktails of phages are compared: the control (λ, T4, T6, and P1) and that designed from ewe feces isolates (A).

