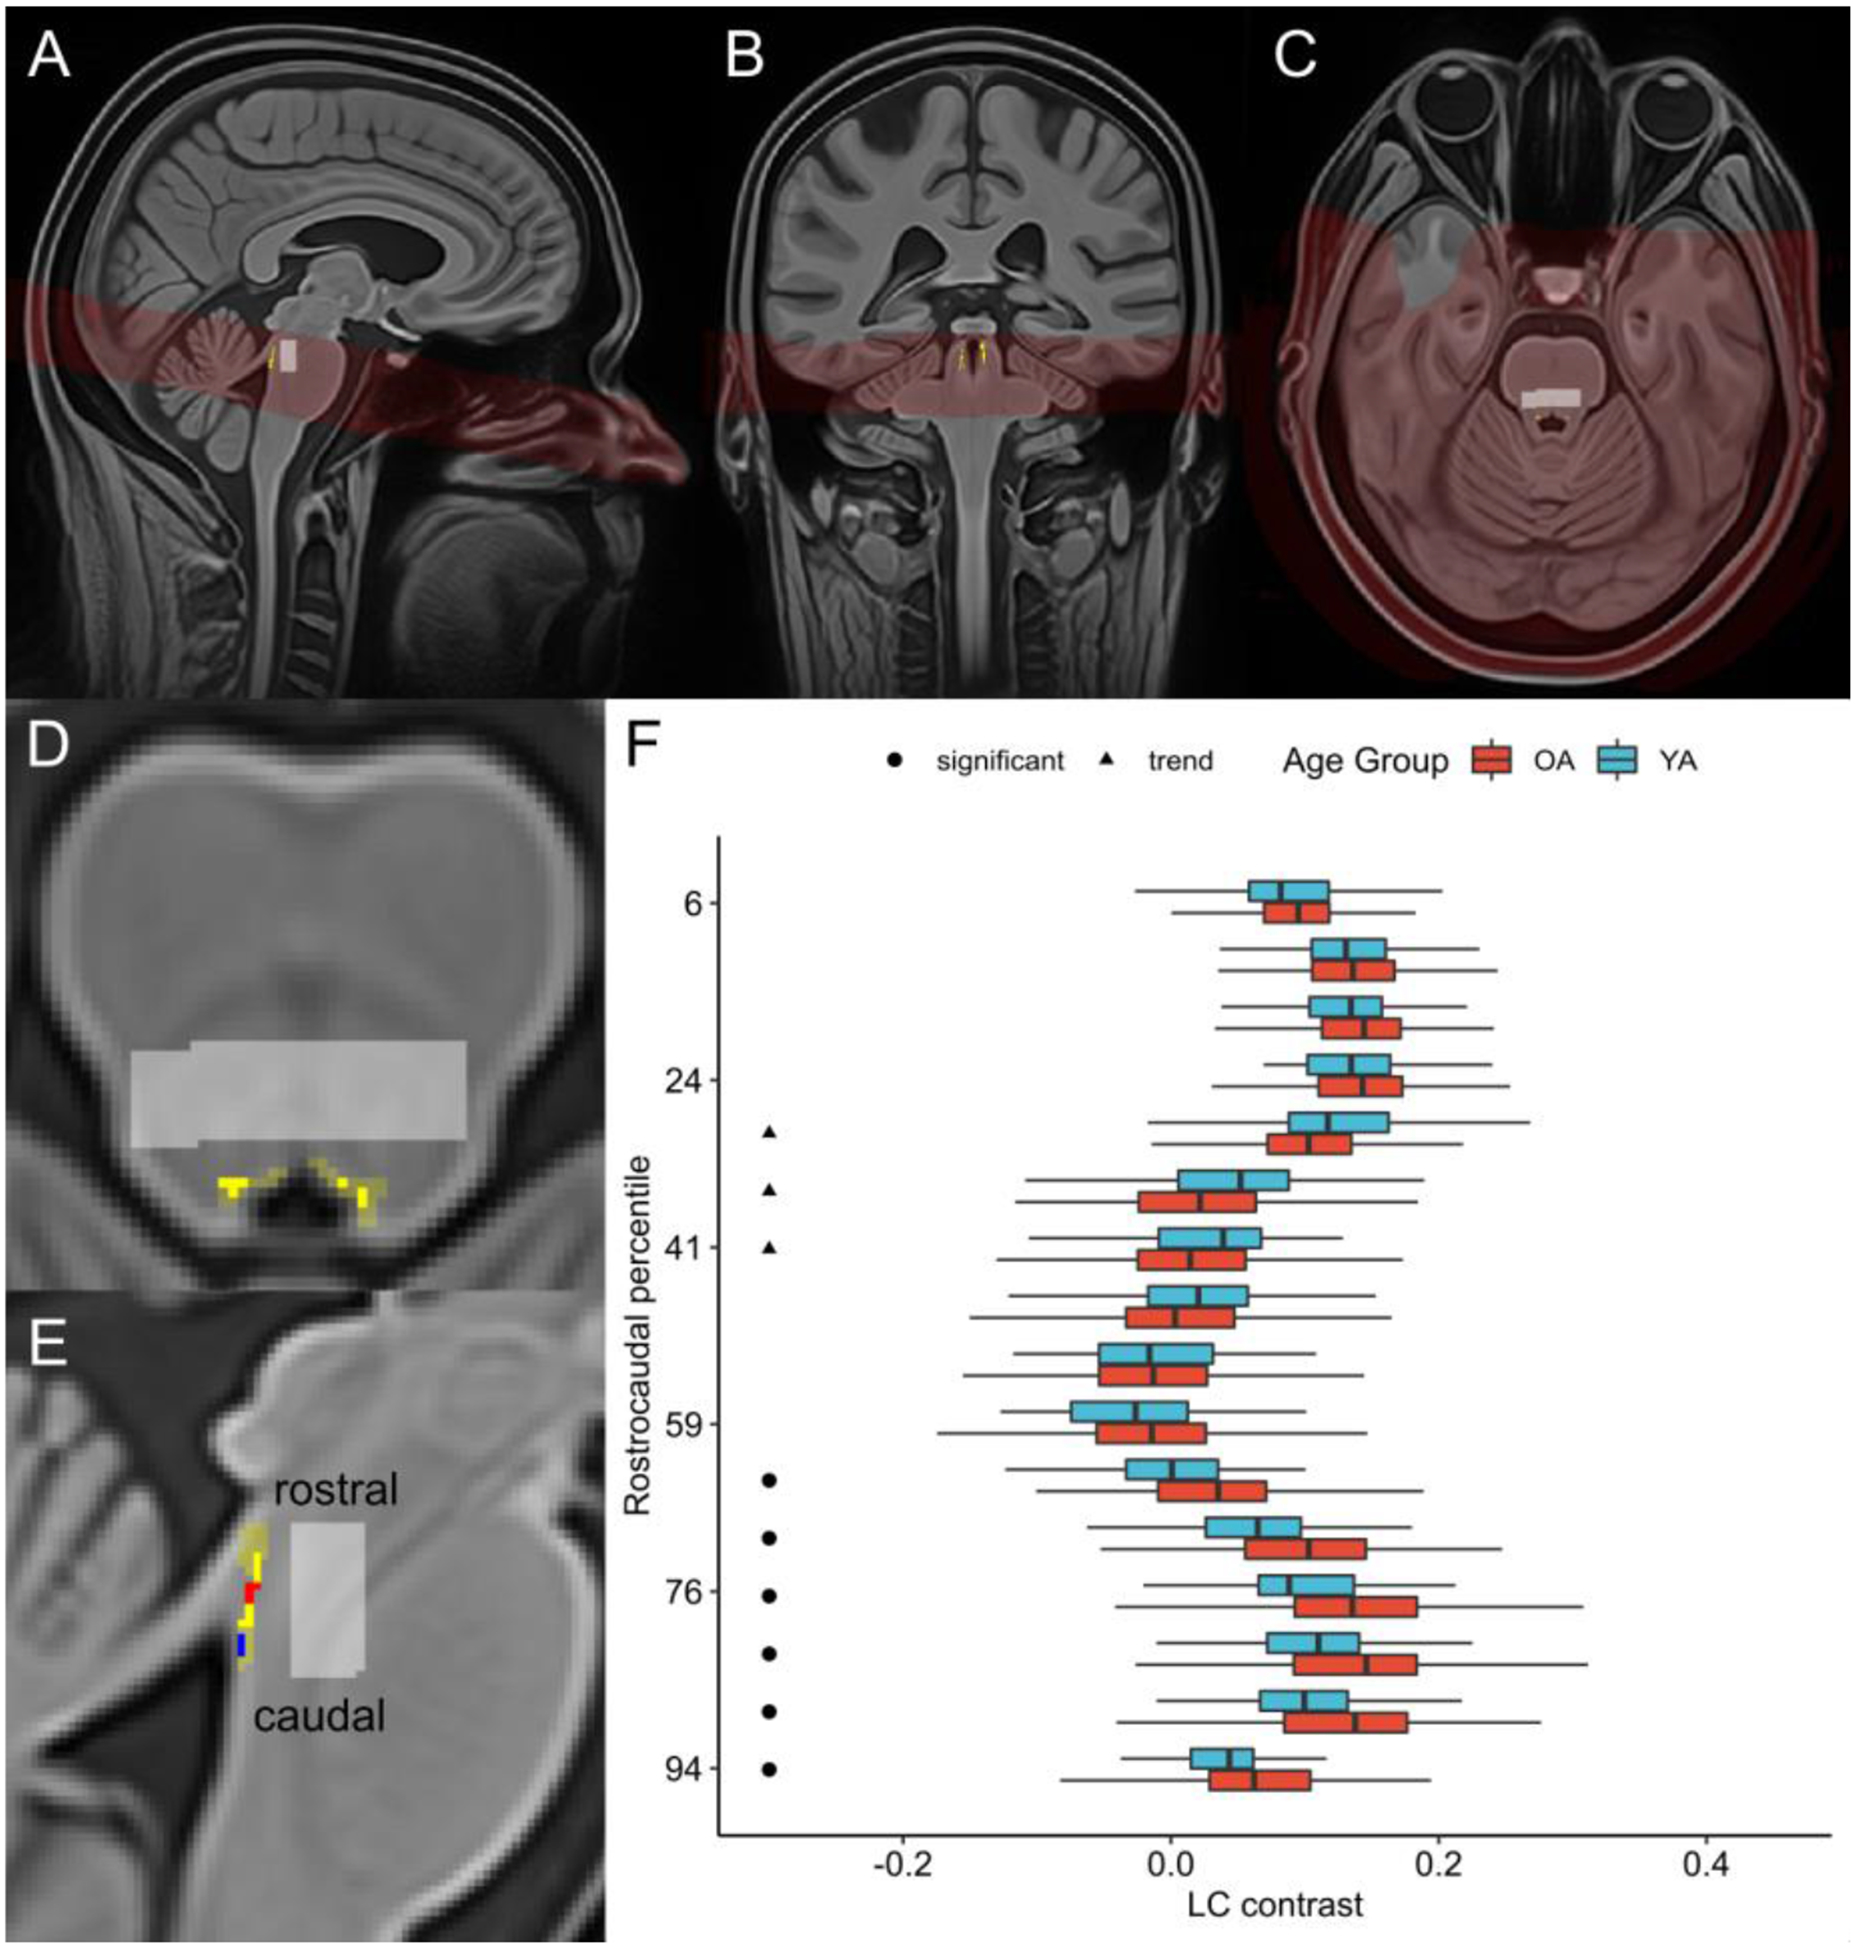
Figure 1.

(A) Sagittal, (B) coronal, and (C) axial views of brainstem template volume (in red; generated from all participants’ turbo spin echo scans) overlaid onto whole-brain template (generated from all participants’ MPRAGE scans), with locus coeruleus (LC) probability map in common template space (Dahl et al., 2019) displayed in yellow. Pontine reference region in common template space is displayed in light gray. (D) Axial and (E) sagittal views of template brainstem volume. LC probability map (opaque yellow) is overlaid onto LC search space (translucent yellow), both of which are shown in common template space. Pontine reference region in common template space is displayed in light gray. In (E), rostral and caudal clusters within LC probability map are depicted in red and blue, respectively. (F) Boxplots depicting LC contrast values along the LC’s rostrocaudal extent are displayed for older adults (OA; red) and younger adults (YA; blue). The y-axis is arranged from most caudal (100) to most rostral (0) LC segment. For visual clarity, outliers – defined as data points falling outside the interval defined by 1.5 times the interquartile range (i.e. below the 25% quantile or above the 75% quantile) – are omitted. A cluster-wise permutation test was performed to identify clusters of slices where contrast differed significantly by age group. Circles indicate a caudal cluster of slices where older adults had significantly higher contrast than younger adults, and triangles indicate a rostral cluster of slices where there was a trend towards older adults having lower contrast than younger adults.
