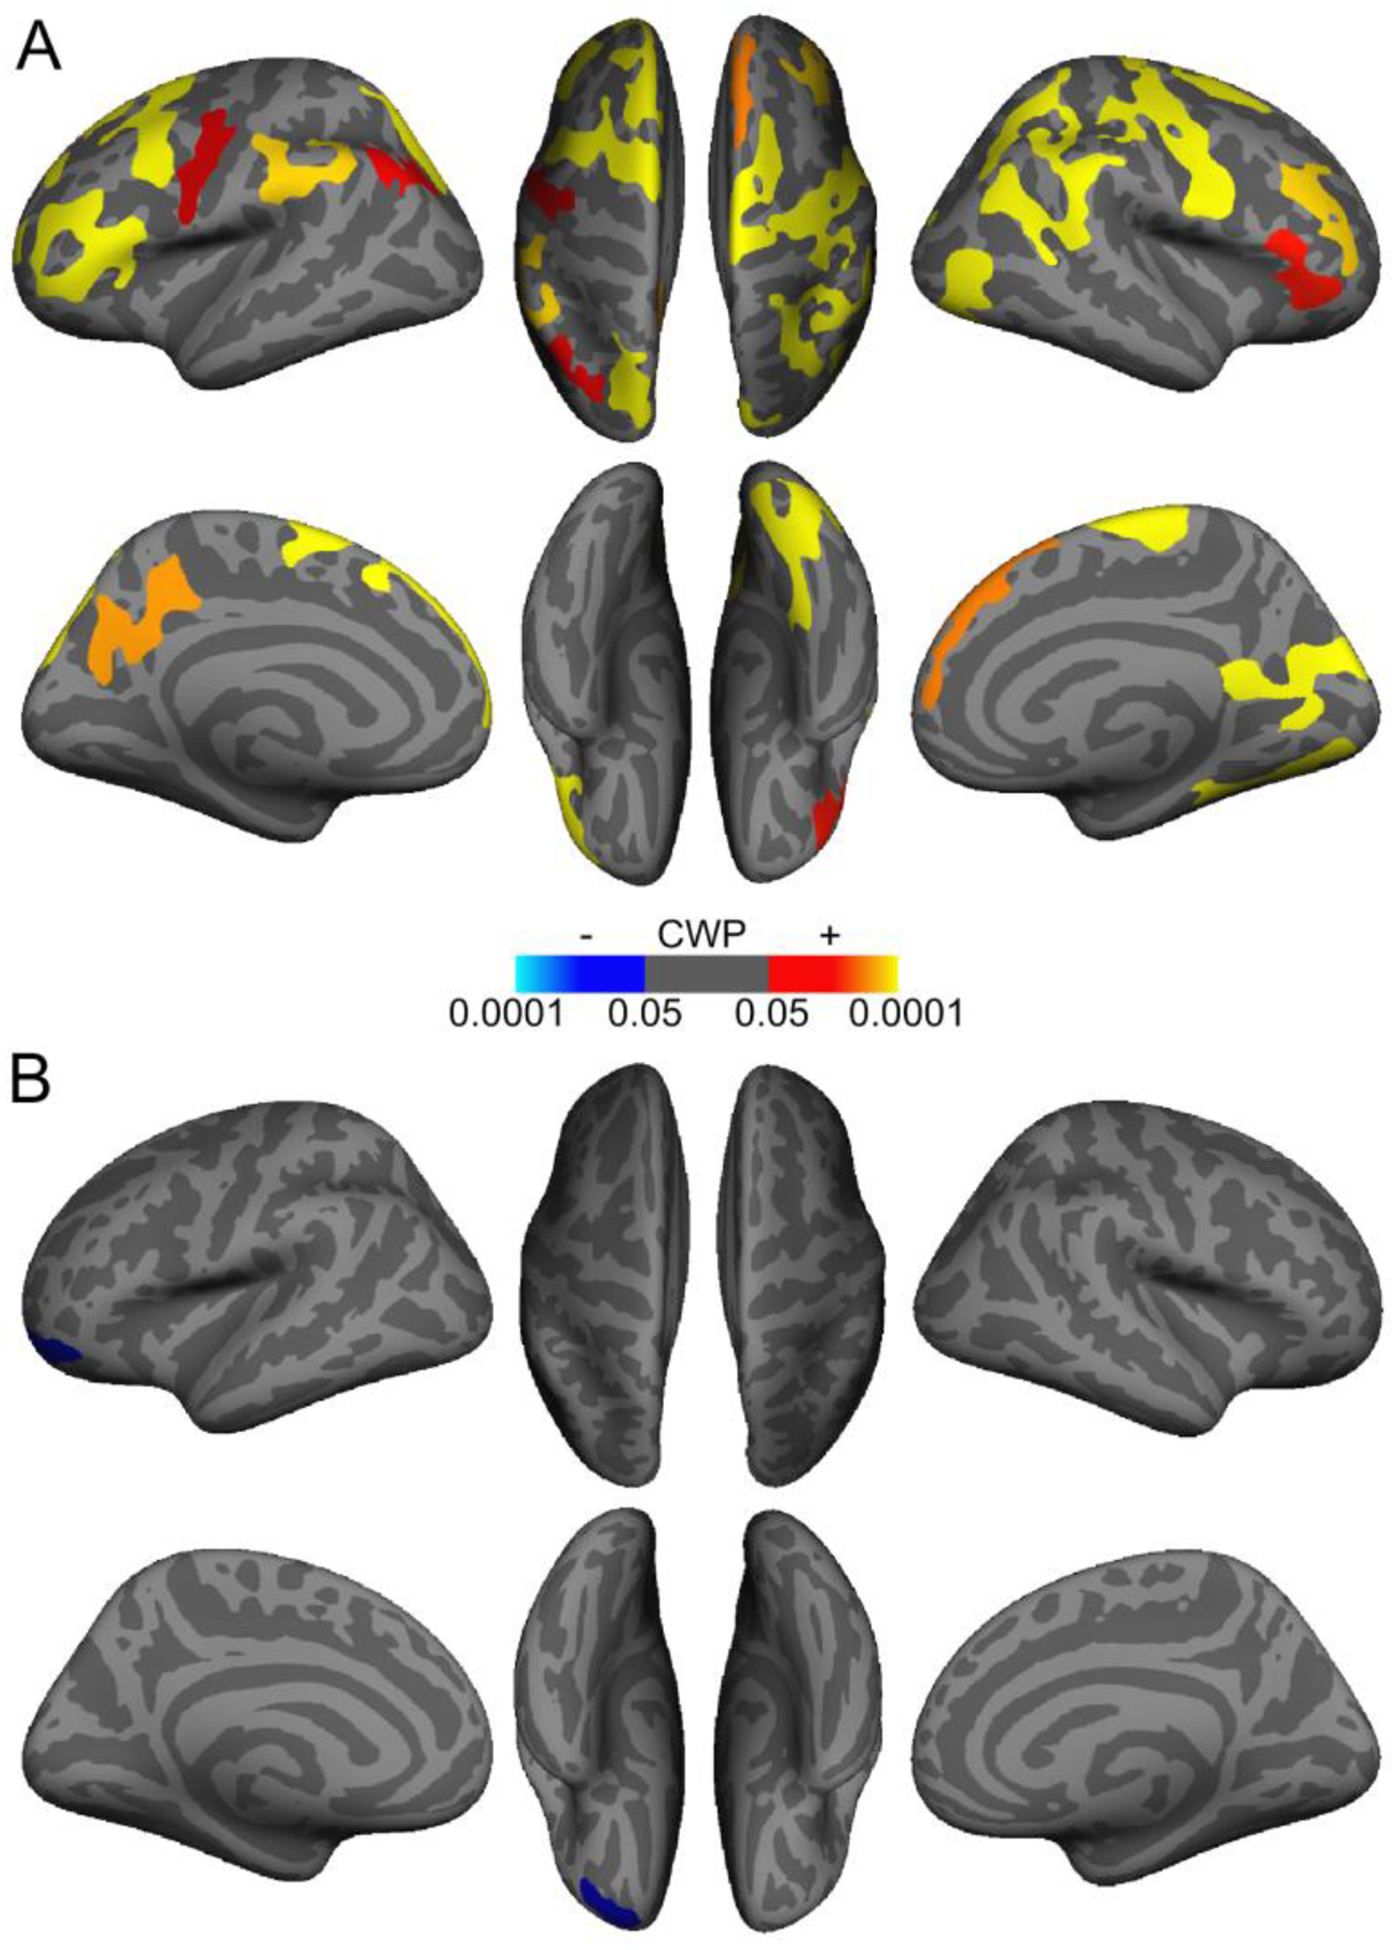
Figure 4.

Cortical regions demonstrating an association between rostral (A) and caudal (B) locus coeruleus (LC) contrast and thickness in older adults. Warmer colors indicate clusters with a positive association between LC contrast and cortical thickness, and cooler colors indicate clusters with a negative association. Only clusters that survived cluster-wise correction for multiple comparisons (cluster-wise probability (CWP) <.05) are shown.
