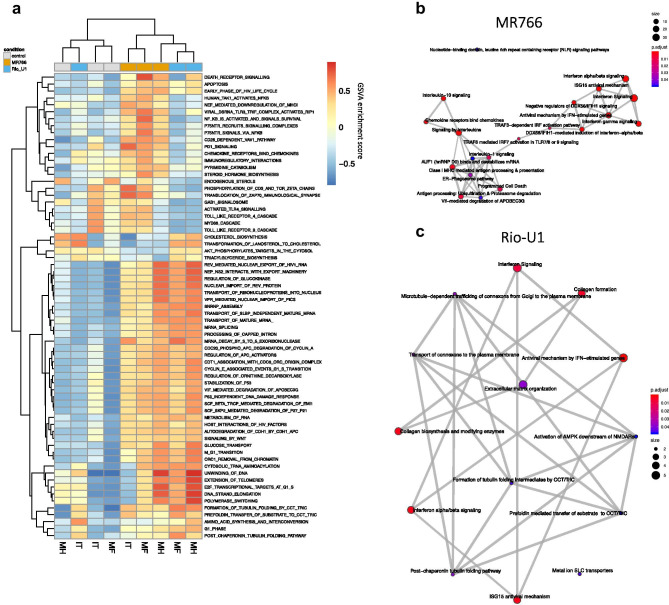
Fig. 3.
Lineage-dependent virus response patterns. a Heatmap showing gene set variation analysis (GAVA) enrichment scores among significantly modulated gene sets. Gene sets in the Reactome databank were included if statistical significance was attained in pairwise comparisons among conditions. Enrichment map plots showing the interrelatedness of gene set networks in astrocytes infected with MR766 b or Rio-U1 c relative to uninfected controls

