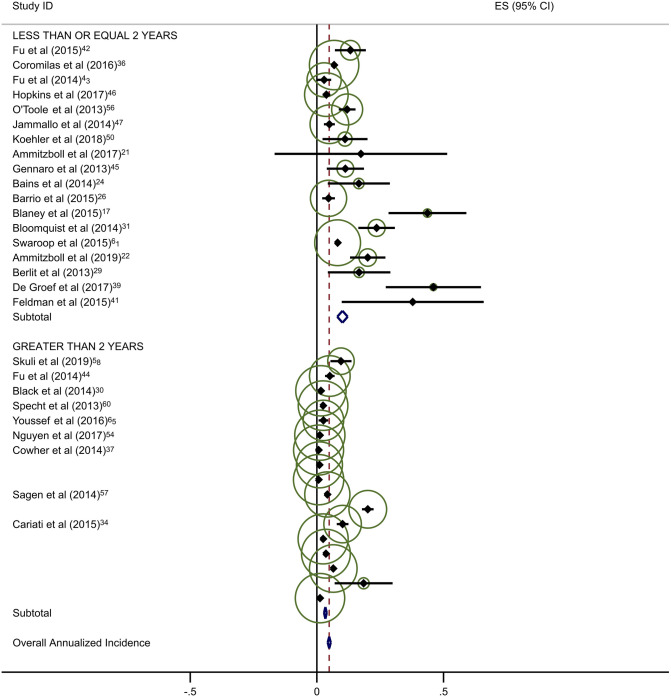
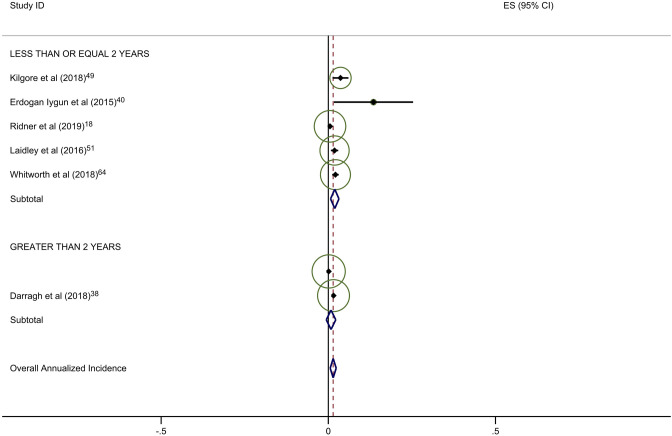
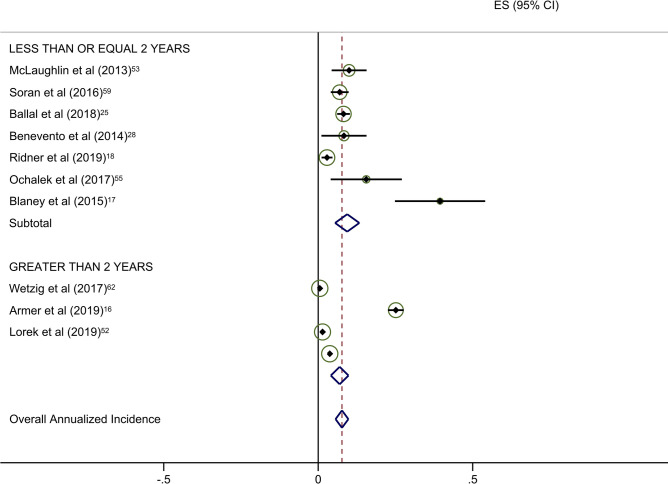
Fig. 2.
a Background studies with 2 year cut point. b BIS studies with 2 year cut point. c Circumference studies with 2 year cut point. Each study is represented by its estimated annualized incidence. The red dotted line is the overall pooled estimated annualized incidence. The light green circles represent the weight for each study to calculate the overall annualized incidence rate and are from the random-effects analysis. The diamond shapes are the variances for each cut point as well as the overall study variance


