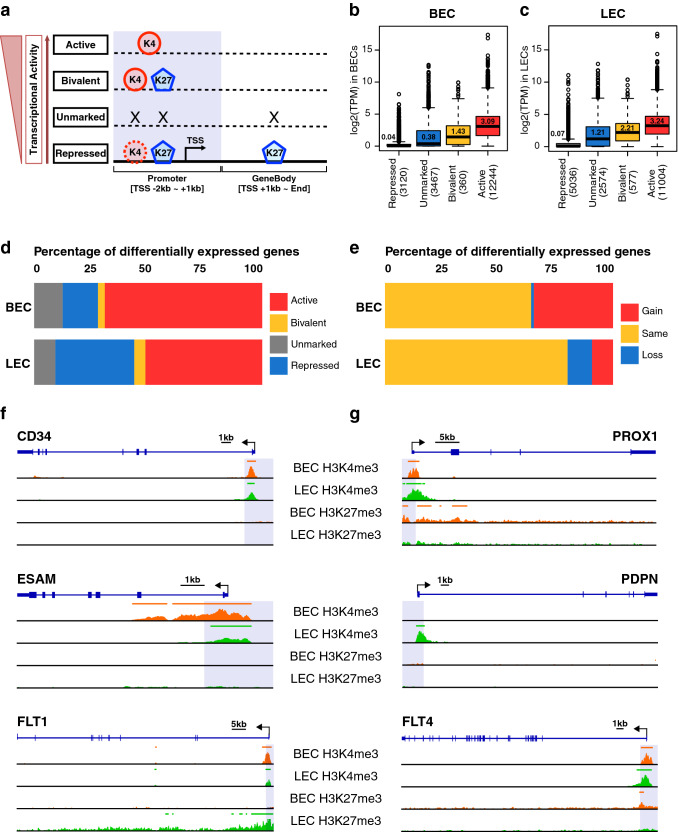
Fig. 2.
LECs and BECs present different H3K4me3 and H3K27me3 enrichment profiles. a Representation of the chromatin composition in each histone state, which was graded by their transcriptional activity. The black arrow labels the transcription start site (TSS) and the direction of the transcription. The promoter region is highlighted in blue. b and c Expressed genes were categorized into the corresponding histone state in BECs and LECs. Transcriptomic abundances were compared among different histone states and the number of genes in each group is indicated in brackets. The numbers inside the box plots denote the medians. d Overview of the histone state of genes with upregulated expression in the respective cell type as determined in Fig. 1a. e Proportion of upregulated genes manifesting a sustained or switched histone state, in contrast to the opposing cell type. Differential histone enrichment profiles of the selected BEC (f) and LEC (g) marker genes. The magnitude of the signal tracks of a given histone modification for a given marker is the same across two cell types. Orange/green bars at the top of each track indicate the called ChIP-Seq peaks

