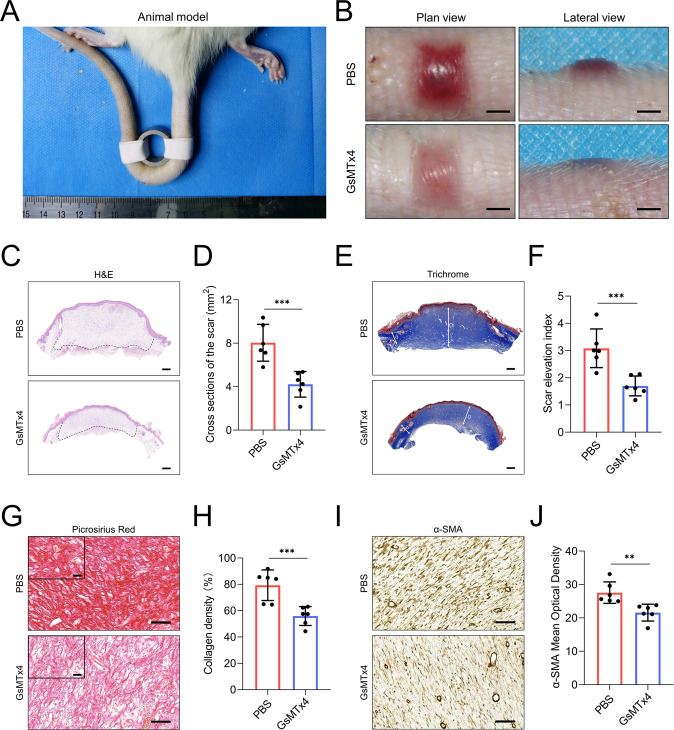
Fig. 5. GsMTx4 attenuates excessive scarring in a stretch-induced rat tail model.
A Animal modeling of stretch-induced scarring in rat tail. B Images of scar appearances and elevations in the PBS-treated group and GsMTx4-treated group (Scale bar = 2 mm). C, D Images and quantitative analysis of cross-sections of scar in PBS-treated group and GsMTx4-treated group. (Scale bar = 500 μm). E, F Images and quantitative analysis of SEI of scars in PBS-treated group and GsMTx4-treated group. (Scale bar = 500 μm). The long arrow ‘D’ represents the thickness of hypertrophic scar tissues while the short arrow ‘d’ represents the thickness of adjacent normal skin tissues. “scar elevation index” is defined as the D/d ratio. G, H Images and quantitative analysis of collagen density of scars in PBS-treated group and GsMTx4-treated group. (Scale bar = 50 μm). Scale bars for the zoom images, 50 µm. I, J Images and quantitative analysis of α-SMA expression in PBS-treated group and GsMTx4-treated group. (Scale bar = 50 μm). Arterioles were excluded from α-SMA quantitation. The results are expressed as the means with SD (n = 6). T-test is used for all analysis. **P < 0.01, ***P < 0.005.

