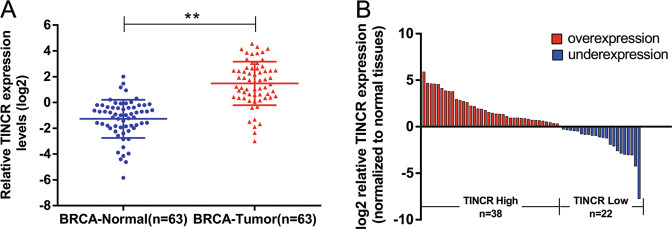
Fig. 1. The relative expression of TINCR in breast cancer tissues and its clinical significance.
A Data from the TCGA database shows the relative expression of TINCR in 63 pairs of breast cancer and adjacent normal tissues. B The qRT-PCR experiment detected the relative expression of TINCR in 60 pairs of breast cancer tissues and their adjacent non-cancerous tissues. According to the level of TINCR expression, the tissues were divided into two groups: TINCR high expression group and TNCR low expression group. Error bars indicate mean ± standard errors of the mean. The mean values of two groups were compared via paired, two-tailed Student t tests. *P < 0.05, **P < 0.01.

