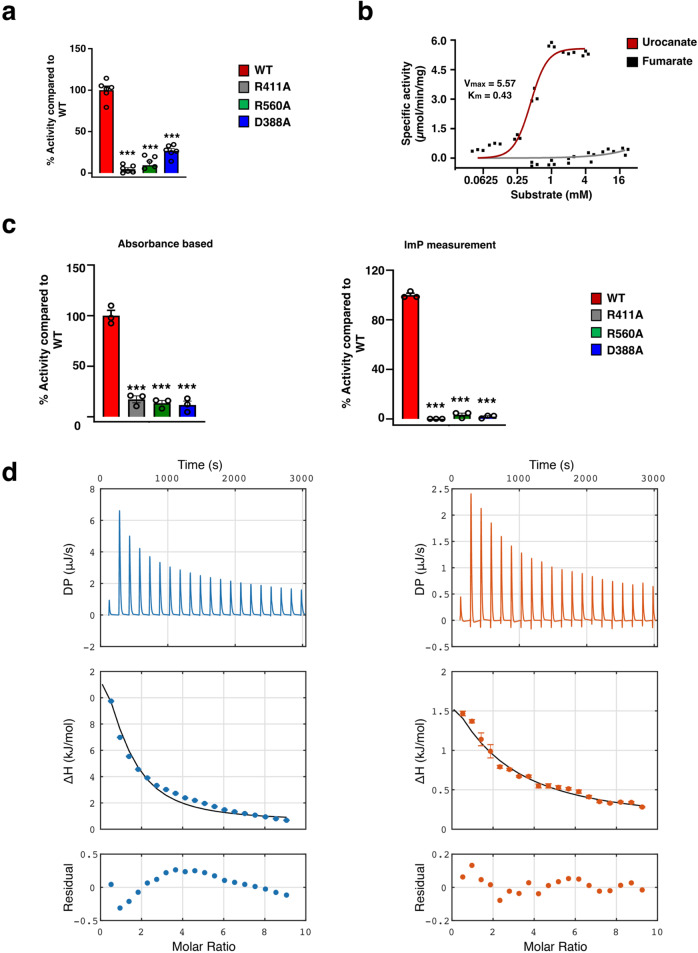
Fig. 2. Activity measurements of UrdA.
a Relative activity of single substitutions, UrdA′R411A, UrdA′R560A, and UrdA′D388A compared to UrdA′wt (n = 6 independent experiments). Data are mean ± s.e.m. ***P < 0.001. One-way ANOVA with Dunnett’s multiple comparisons test, P value < 0.0001. b Activity and specificity of the full-length UrdA toward varying concentrations of urocanate (n = 3 independent experiments) or fumarate (n = 3 independent experiments) measured in presence of FAD. c Relative activity of single substitution variants, UrdAR411A, UrdAR560A, and UrdAD388A compared to the full-length UrdAwt in an absorbance-based measurement (left, n = 3 independent experiments) and in a direct measurement of ImP production (right, n = 3 independent experiments). Data are mean ± s.e.m. ***P < 0.001. One-way ANOVA with Dunnett’s multiple comparisons test, P value < 0.0001. d ITC measurement of urocanate (blue) and of ImP (orange) binding to UrdA′, showing a representative dataset for each ligand. The full line shows the simultaneous fit to three replicate datasets. Errors in individual ITC data points are estimated based on the baseline uncertainty, as described36. Source data are provided as a Source data file.

