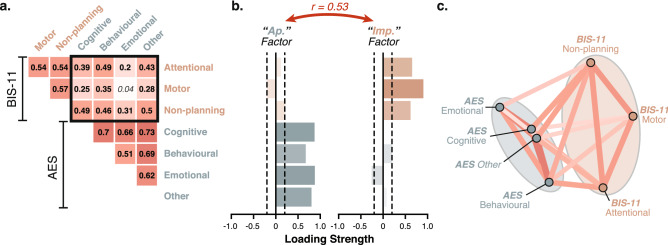
Figure 2.
All dimensions of the AES (apathy) and BIS-11 (impulsivity) positively correlate. (a) The correlation matrix of the sub-scale scores of the AES and BIS-11 questionnaires showed positive correlations only (; Datasets 1–4). Significant pairwise correlations are shown in bold (Bonferroni-corrected). The black square highlights cross-questionnaire associations. (b) Factor decomposition (EFA) of this matrix uncovered dissociable, nevertheless positively correlated (), “Apathy” and “Impulsivity” factors. (c) In this network plot, sub-scale scores that are more highly correlated (positively or negatively) appear closer together and are joined by stronger paths (non-significant paths removed). Paths are also coloured by their sign (red for positive and blue negative). Ellipses are drawn around the sub-scores included in a factor. Note, here all paths are positive, even those connecting the two factors together. See also Fig. S1 for the same plots split by dataset.

