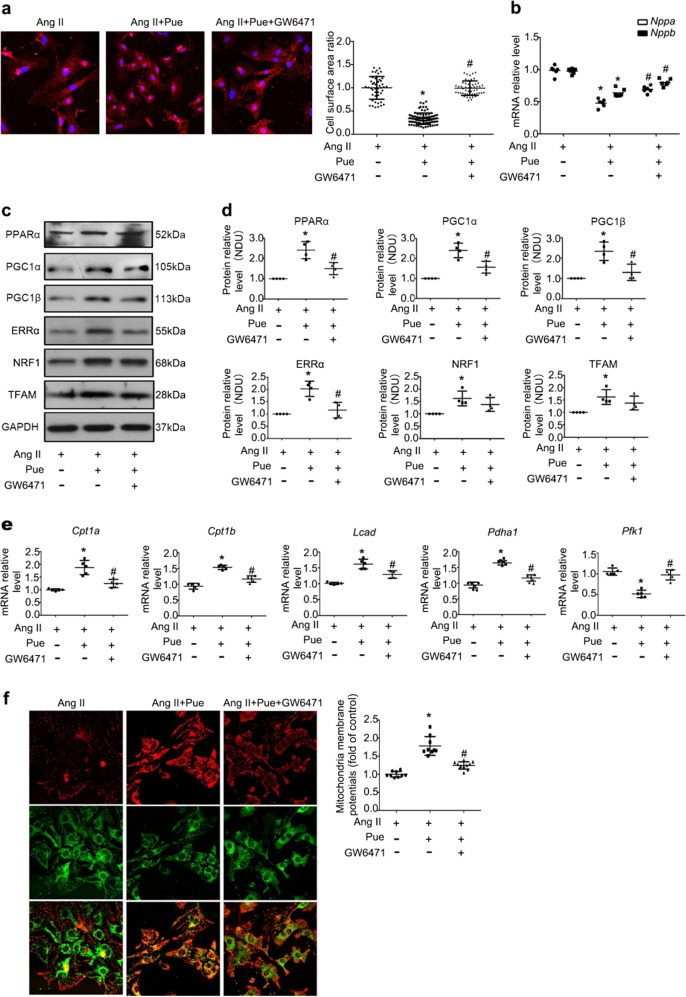
Fig. 9.
Puerarin protects against cardiomyocyte hypertrophy through activation of PPARα. a: Representative confocal images and measurement of surface area of cardiomyocytes subjected to different treatments, as indicated; n = 40–50 cells per group. b Reverse transcription-polymerase chain reaction analysis of Nppa and Nppb in NRCMs subjected to the indicated treatments. Data are representative of five independent experiments. c, d Representative Western blots of whole lysates (c) and fold changes (d) in the relative densitometric values of PPARα, PGC-1α, PGC-1β, ERRα, NRF1, and TFAM in NRCMs under different treatments. Data are representative of four independent experiments. e Reverse transcription-polymerase chain reaction analysis of Cpt1a, Cpt1b, Lcad, Pdha1, and Pfk1 in treated NRCMs. Data are representative of six independent experiments. f Representative confocal images of JC-1 staining and quantitative analysis of fluorescence in treated NRCMs. Scale bar = 50 μm. Data are presented as the mean ± SD. Statistical significance was determined using one-way ANOVA coupled with Tukey’s multiple comparison post hoc test. *P < 0.05 vs. Con group; #P < 0.05 vs. Ang II group; n = 10–12 cells per group

