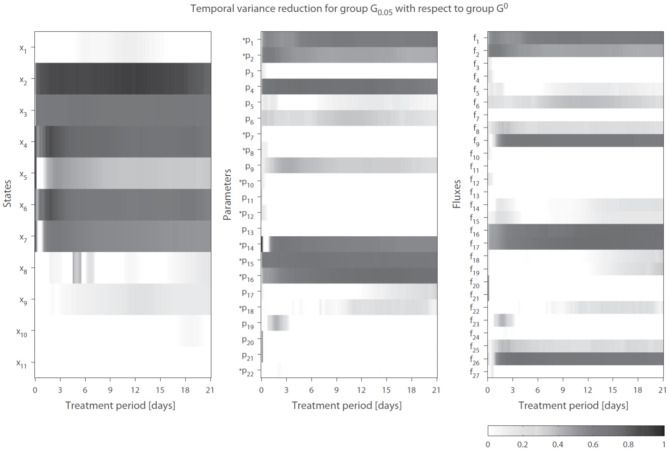
Figure 4.
Temporal variance reduction by incorporating gene expression data. The gray-intensity indicates reduction in variance for estimated state variables (left), parameters (middle), and fluxes (right). The asterisk signs (*) indicate parameters that were coupled to one or multiple genes. The (dark-)gray parts display model estimates that were effectively constrained by the gene expression data. Results shown for group G0.05, containing 5% of the trajectory solutions with the highest temporal correlation between parameter trajectories and gene expression (lowest penalty by ). Compared to G0, which are the solutions obtained without regularization Note f14 = f28 + f29.

