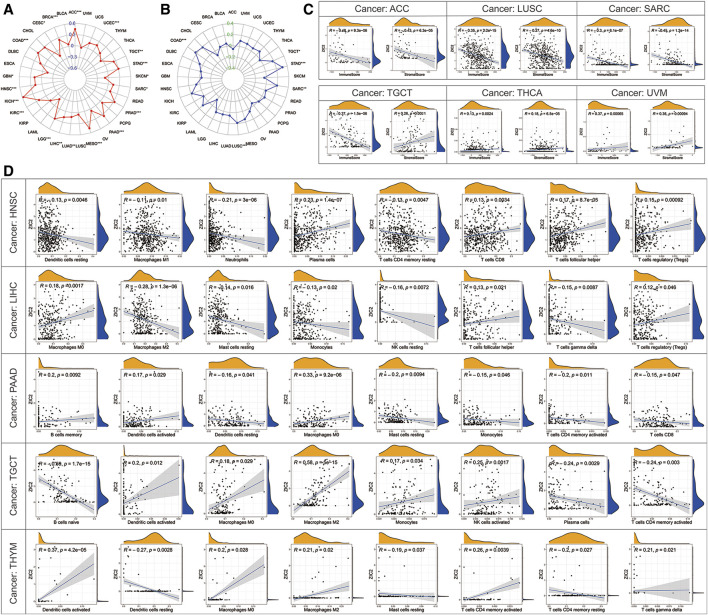
FIGURE 8.
Correlation of ZIC2 expression and TMB, MSL and tumor immune microenvironment. (A,B) The radar graphs of correlation of ZIC2 with TMB and MSL. The coordinate value corresponding to each point is the correlation coefficient. (***p < 0.001; **p < 0.01; *p < 0.05) (C) Correlation of ZIC2 with immune score and stromal score. (D) Correlation of ZIC2 with the content of all immune cells.

