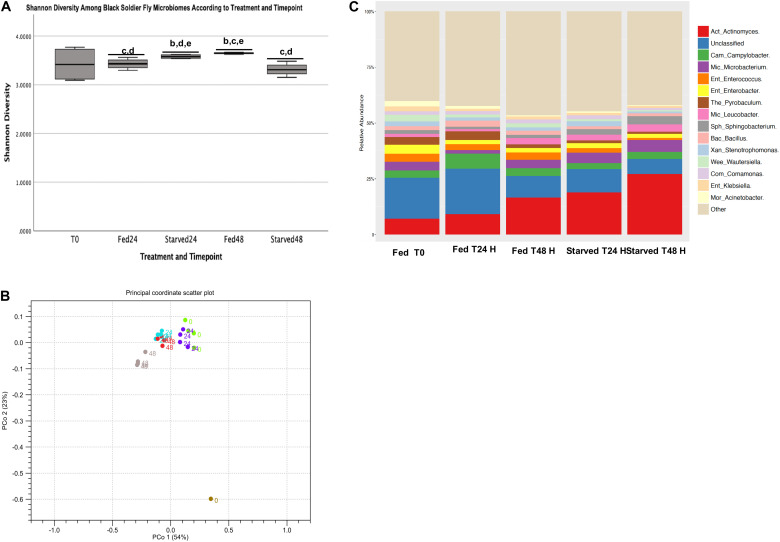
FIGURE 3.
Genus level Shannon diversity and Relative Abundance. (A) Alpha diversity using Shannon index. (B) Principal coordinate plots using Bray-Curtis distances of individual fed and starved black soldier fly microbiome samples and a single feed sample. (C) Genus leval taxa with relative abundance greater than 5% across Fed and Starved Groups at T0, T24 H, and T48 H.

