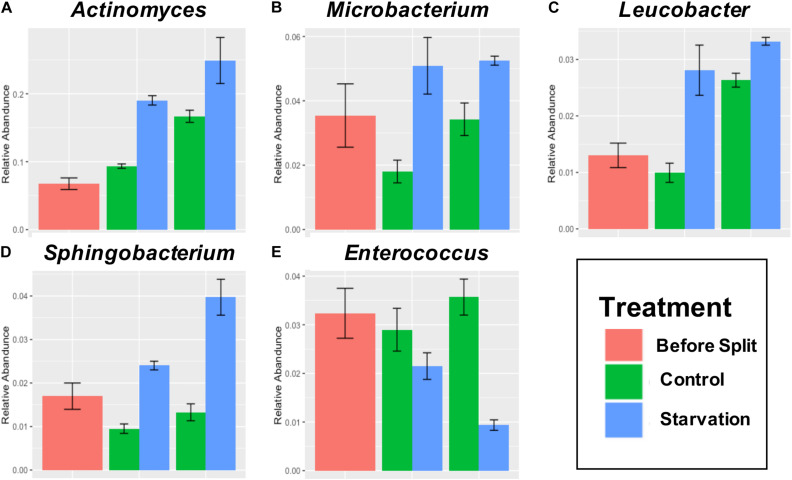
FIGURE 4.
Mean relative abundance greater than 5% and significantly different (q < 0.05) abundance at both T24 H and T48 H for Genera Actinomyces (A), Microbacterium (B), Leucobacter (C), Sphingobacterium (D), and Enterococcus (E). T0 is the initial timepoint prior to division into Fed and Starved treatments.

