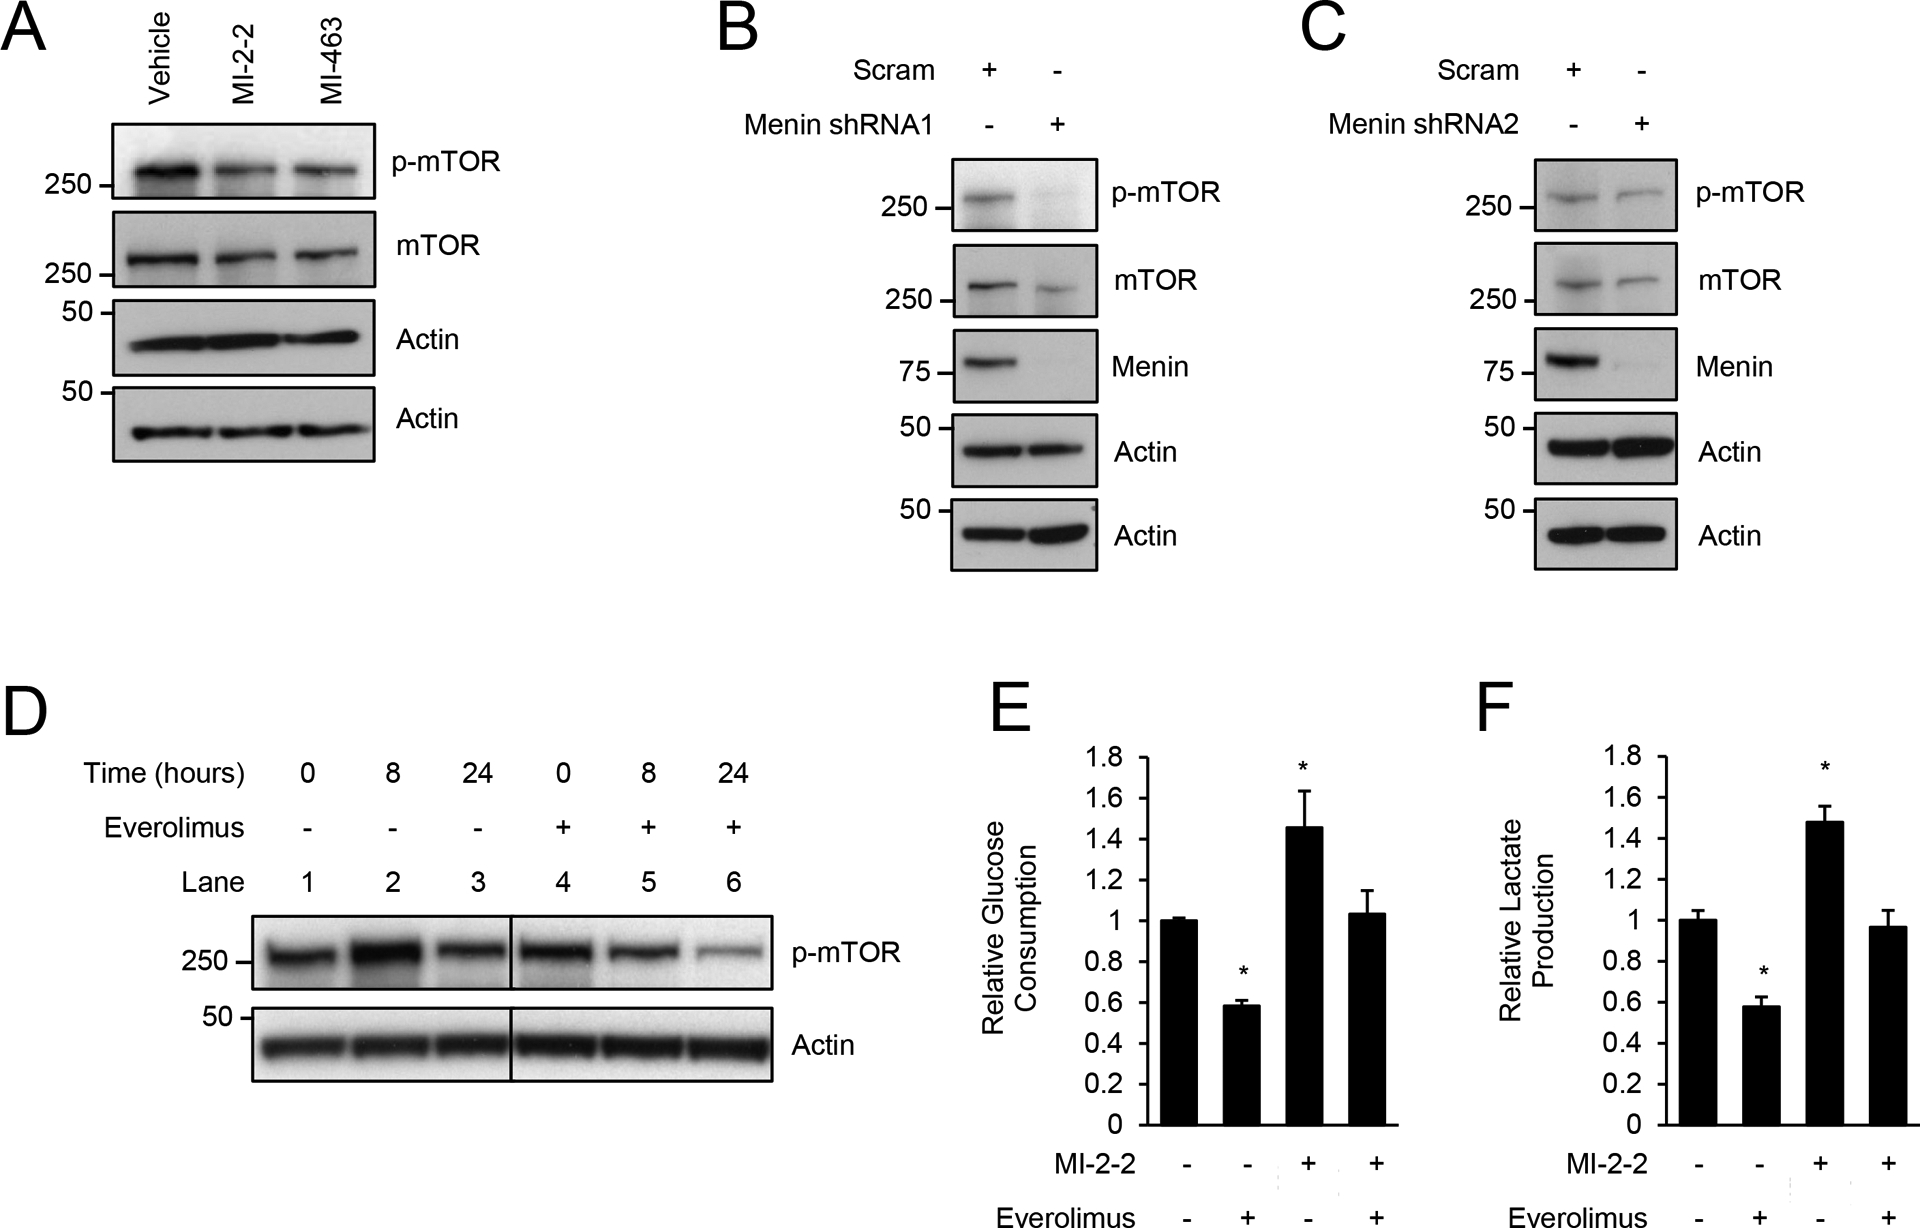
Figure 2: Menin inhibitors increase glycolysis independent of mTOR.

A) Treatment of HT-29 cells for 96 hours, 1 μM MI-2–2, 1 μM MI-463. B/C) HT-29 cells transduced with scrambled, menin shRNA1 (B), or menin shRNA2 (C). D) Treatment of HT-29 cells for various times, 1 μM everolimus. E/F) HT-29 cells were pre-treated with vehicle, 1 μM MI-2–2, and/or 1 μM everolimus for 24 hours, followed by assessment of glucose consumption (E) and lactate production (F) over an 8-hour period. * p < 0.05.
