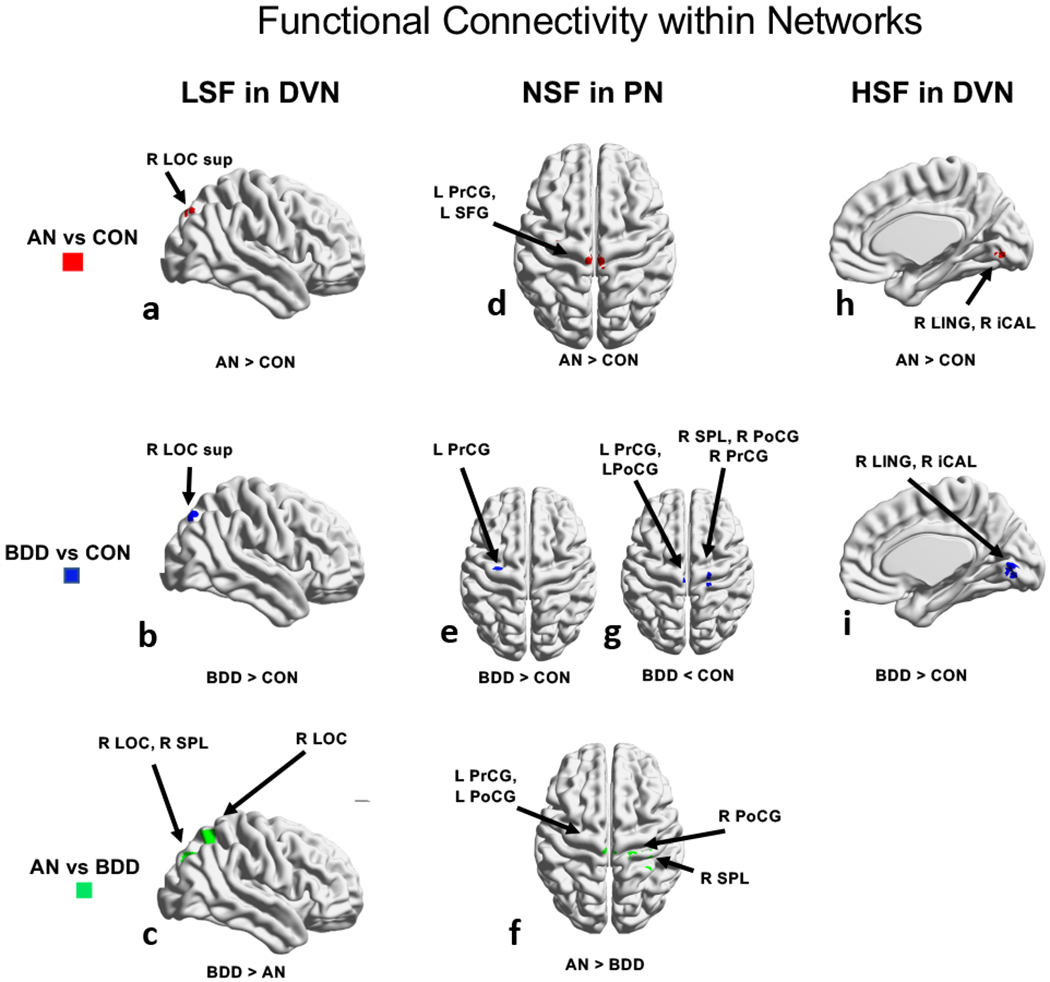
Fig. 5.

Functional connectivity differences among groups. ANOVA identified regions differing among the 3 groups, using threshold-free cluster enhancement with a family-wise error correction at p<0.05, followed by pairwise group comparisons within significant regions. Between group results in dorsal visual network are shown: (5a-c) for low spatial frequency images, (5d-g) for normal spatial frequency in parietal network, and (5h-i) for high spatial frequency images. The rendered figures are registered to a 2mm MNI brain, but the analyses were performed in 4mm space. Abbreviations: AN, anorexia nervosa; BDD, body dysmorphic disorder; CON, controls; D, dorsal; F, frontal; L, left; R, right.
