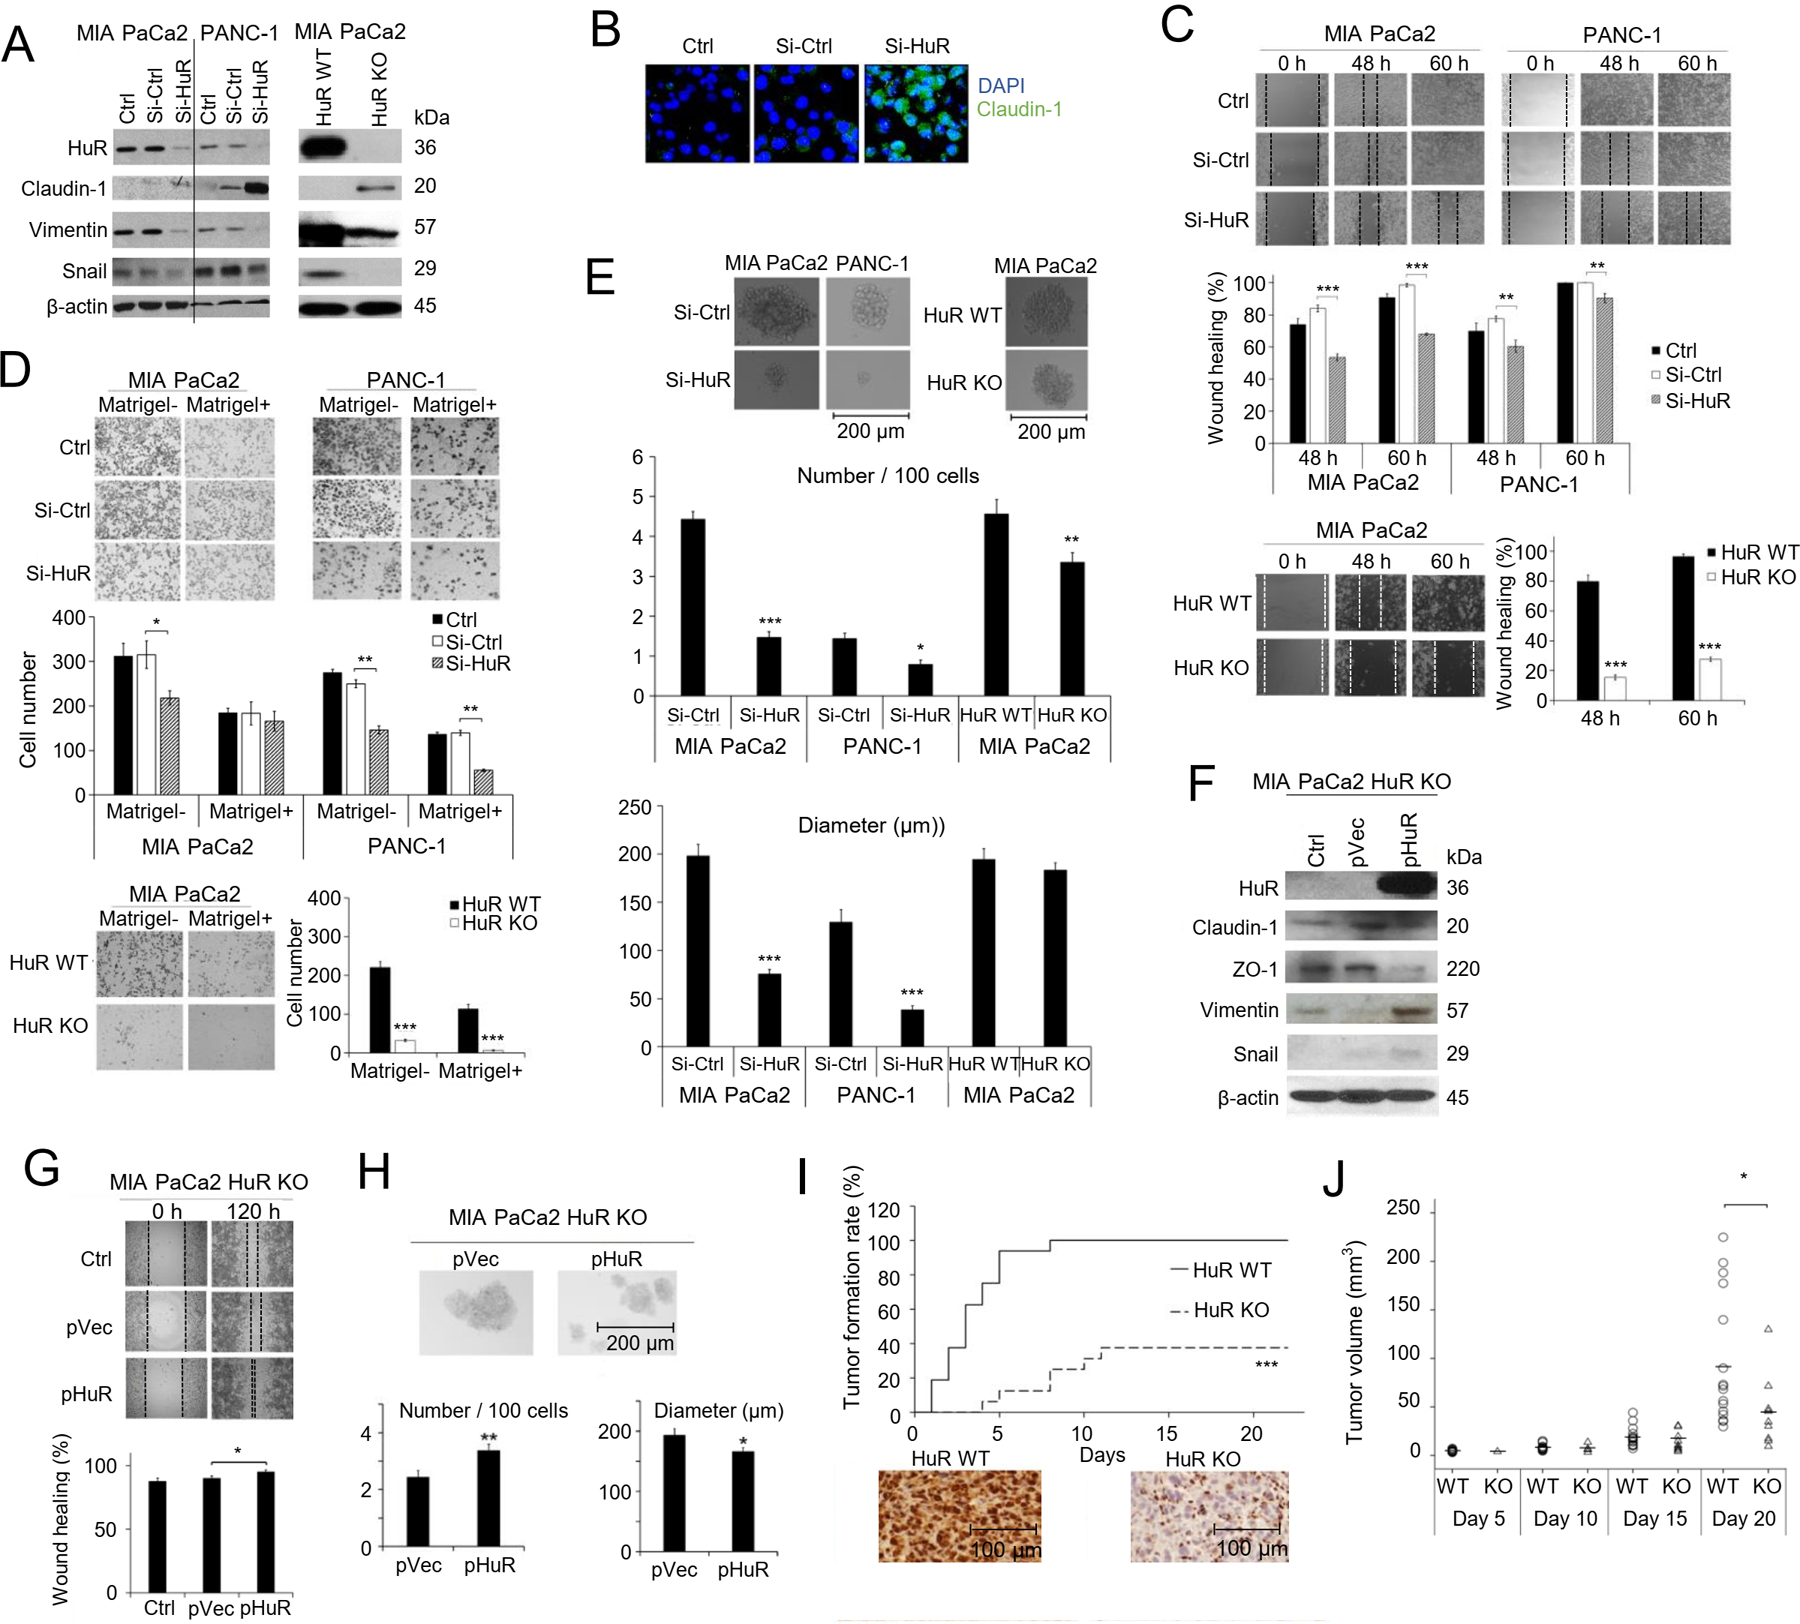
Fig. 1. HuR enhances pancreatic cancer cell EMT, migration, and CSCs.

A. Western blot in MIA PaCa-2 and PANC-1 cells showing expression of HuR and markers of EMT. β-actin was a loading control. Left: Cells were transfected with Si-Ctrl or Si-HuR for 24 h, or un-transfected (Ctrl). Right: HuR KO were cells knockout of HuR gene by CRISPR/Cas9 procedure. HuR WT were cells transfected with control sgRNA. B. Immunofluorescence staining for Clauind-1. Cell nuclei were DAPI stained. C. Scratch assays. Bar graphs represent Mean ± SEM of ≥ 3 repeats. D. Matrigel invasion assays. Cell migration (Matrigel-) and invasion (Matrigel+) were detected at 24 h for PANC-1 cells and 48 h for MIA PaCa-2 cells. Bar graphs show the Mean ± SEM of migrated/invaded cells per field of > 3 fields per experiment for 3 experiments. E. Tumor spheres formation assay. Bar graphs show Mean ± SEM of 36 repeats. *, p<0.05; **, p<0.01; ***, p<0.001 with one-way ANOVA-Tukey’s test. F-H. HuR re-expression rescues the effects of HuR knockdown. F. Western blot in MIA PaCa-2 HuR-KO cells after HuR re-expression. Ctrl were HuR KO cells, pVec were HuR KO cells transfected with empty vector, and pHuR were HuR KO cells transfected with HuR gene. β-actin was a loading control. Scratch assays (G) and tumor spheres formation (H) in MIA PaCa-2 HuR KO cells with HuR re-expression. Bar graphs represent Mean ± SEM of 3 – 36 repeats. *, p<0.05; **, p<0.01; ***, p<0.001 with one-way ANOVA-Tukey’s test. I. In vivo tumor formation of MIA PaCa-2 HuR WT cells and HuR KO cells in nude mice (n=16 per group). Cells were subcutaneously inoculated at 2×10⁶ cells per injection. Immunohistochemistry blotted for HuR expression in tumor tissues. ***, p<0.001 with Log-rank test. J. Volume of the tumors formed in I. Each circle or triangle represents a tumor. The short bars show the mean tumor volume of each group. *, p<0.05 with Mann-Whitney U test.
