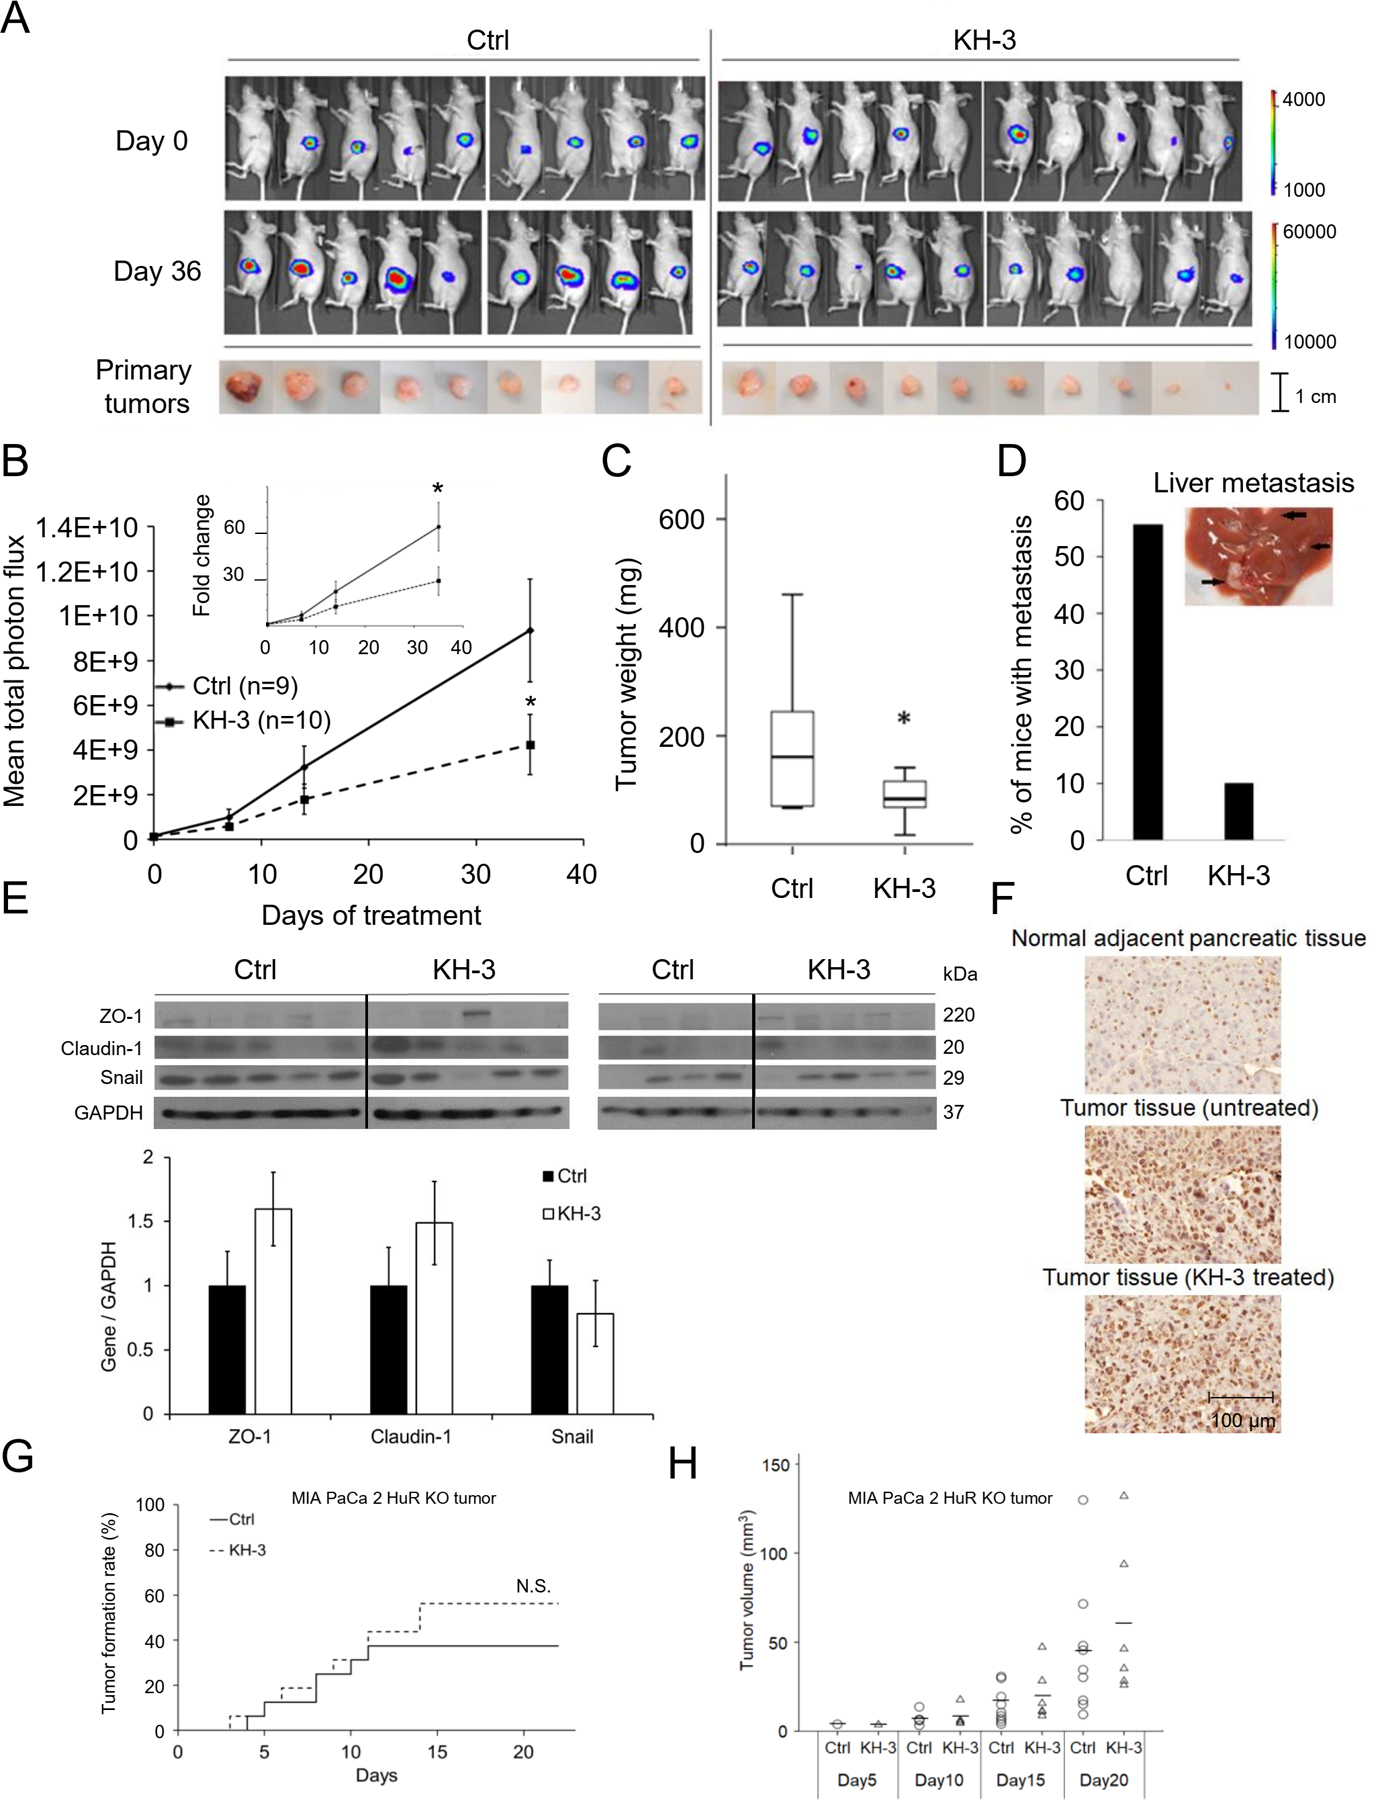
Fig. 6. KH-3 inhibits an HuR positive pancreatic cancer growth and metastasis in vivo.

A. Upper: Bioluminescence images of mice bearing PANC-1-Luc orthotopic pancreatic xenografts treated with KH-3 (100mg/kg, 3 × weekly, n=10), or vehicle (Ctrl, n=9). Lower: Tumor in the mice pancreas at the end of the treatment (Day 36). B. Average tumor burden by IVIS imaging, quantified as photons/sec/cm2 (Mean ± SEM). *, p<0.05 with Student’s t-test. C. Average tumor weight at the end of the treatment. D. Percentage of mice having metastatic lesions in the liver at the end of the treatment. E. Western blot in mice tumor tissues showing EMT markers. Bar graphs show average band intensity of each gene relative to GAPDH. F. Immunohistochemistry showing HuR expression in tumor tissues and adjacent normal pancreatic tissues. G. Subcutaneous tumor formation of MIA PaCa-2 HuR KO cells with and without KH-3 treatment (n=16 for each group). Log Rank test resulted in no significant difference. H. Volume of the subcutaneous tumors formed in G. Each circle or triangle represents a tumor. The short lines represent average tumor volume of each group. Mann–Whitney U tests on each day demonstrated no significant differences.
