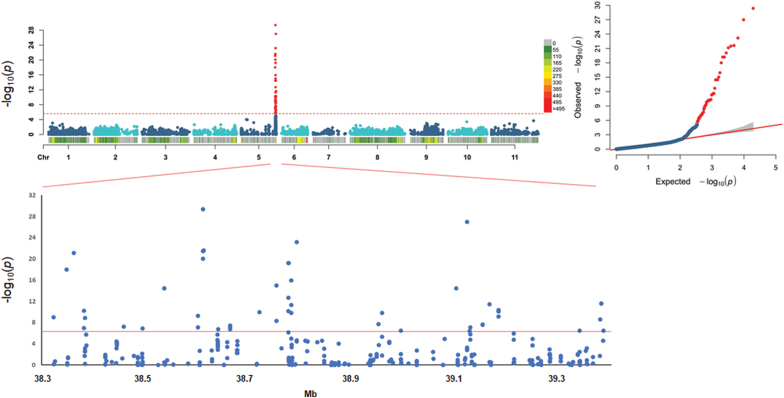
Fig. 4.
Genome-wide association study for occurrence of pod shattering. Top left: Manhattan plot to show the associations between 52 SNP markers (red dots on the distal region of chromosome Pv05) and the SH y/n trait (dehiscent versus indehiscent lines). Dashed red line, fixed threshold of significance for the 19 420 SNP markers physically distributed across the 11 common bean chromosomes. Top right: QQplot of the distribution of the observed P-values compared with the expected distribution. Bottom: expanded major QTLs on the distal part of chromosome Pv05, defining the significance of the SNP markers from 38.3 Mb to 39.4 Mb on chromosome Pv05.

