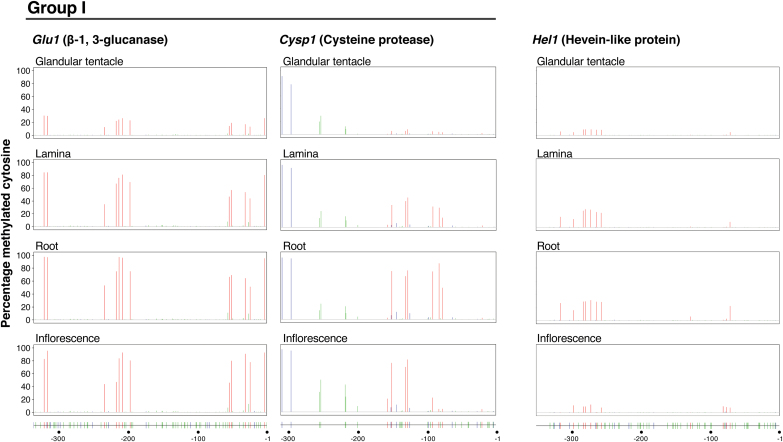
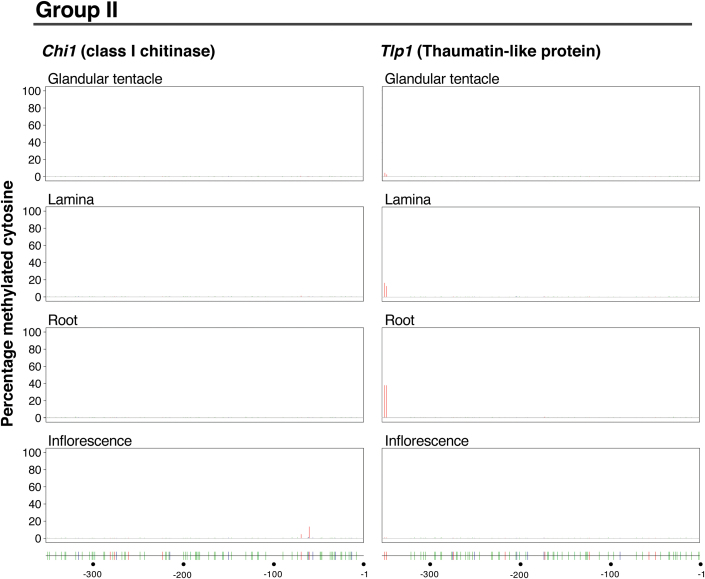
Fig. 4.
Organ-dependent DNA methylation profiles of the genes encoding the major hydrolytic enzymes. Focusing on the genes Glu1, Cysp1, Hel1, Chi1 and Tlp1, the DNA methylation status of the upstream region of the TSS was examined in several organs, including glandular tentacles, laminas, roots and inflorescences. Histograms show the percentages of methylation at cytosine residues in CG, CHG and CHH contexts: CG, red; CHG, blue; CHH, green (averages of three individual plants). The lower diagrams show the positions of cytosines in the same contexts with the same colors. According to the methylation characteristics, the genes were grouped as group I, almost unmethylated only in glandular tentacles; group II, almost unmethylated in all organs examined.


