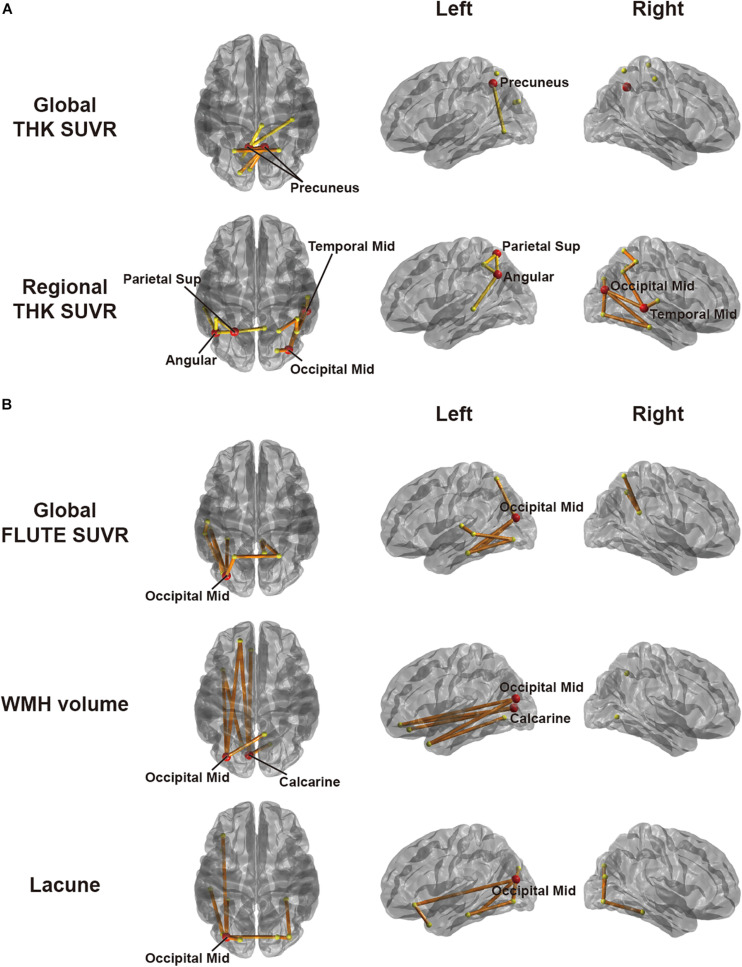
FIGURE 3.
Subnetworks identified by correlation analyses between W-score networks and pathologies in (A) EOAD and (B) LOAD through cluster-based statistics. The factors used include global and regional THK retention in EOAD and global FLUTE retention, white matter hyperintensity volume, and lacunes in LOAD. Regional retention indicates the averaged retention between regions at both ends of an edge. The red circles are representative regions, with nodal degree exceeding the mean plus standard deviation of all nodal degrees. Edges within different clusters were displayed with different colors.

