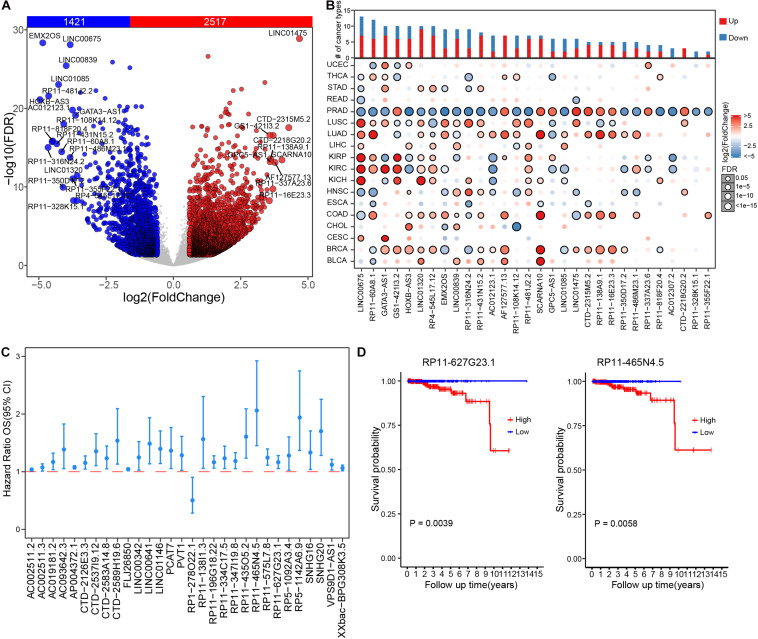
FIGURE 1.
Dysregulation and clinical relevance of lncRNAs in prostate cancer. (A) Volcano plot shows the expression difference of lncRNA in prostate cancer samples compared to those paired adjacent normal samples. (B) The expression changes of top 30 differential lncRNAs of prostate cancer across 18 TCGA cancer types. (C) The survival risk assessment of differential lncRNAs, showing top significant lncRNAs (FPKM >1) in univariate regression analysis. (D) Kaplan–Meier curve of RP11-627G23.1 and RP11-465N4.5 in PRAD cohort.

