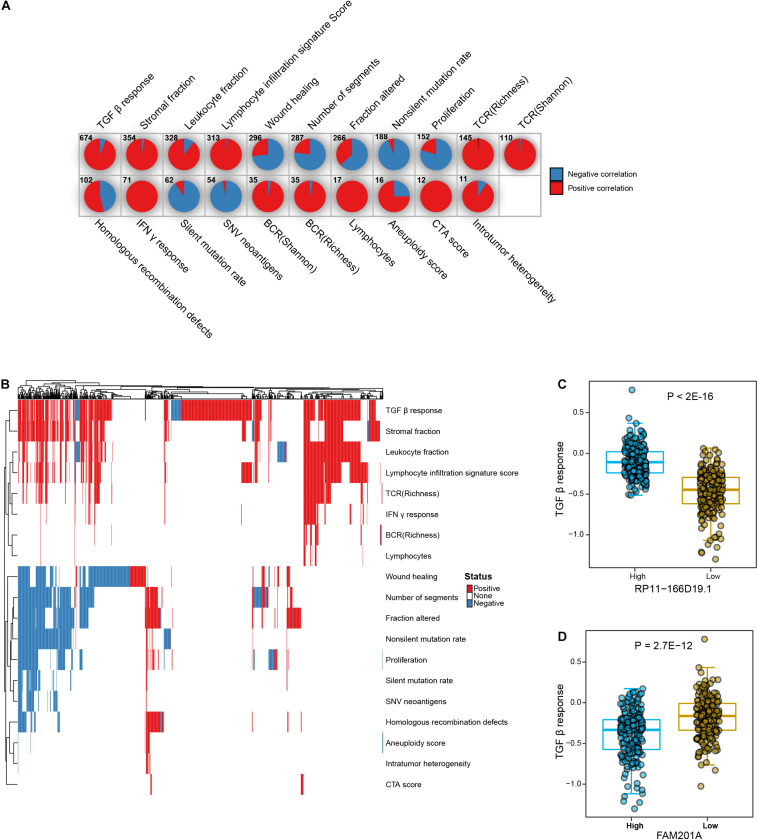
FIGURE 3.
Associations between lncRNAs and tumor immune signature. (A) Pie charts show the numbers of significant positively and negatively correlated lncRNAs in each type of immunogenomic signatures. (B) Heatmap shows the landscape of significant correlated lncRNAs across different immunogenomic signatures. (C) Comparison of TGF-β response scores between high and low expression level of RP11-166D19.1 in PRAD samples. (D) Comparison of TGF-β response scores between high and low expression level of FAM201A in PRAD samples.

