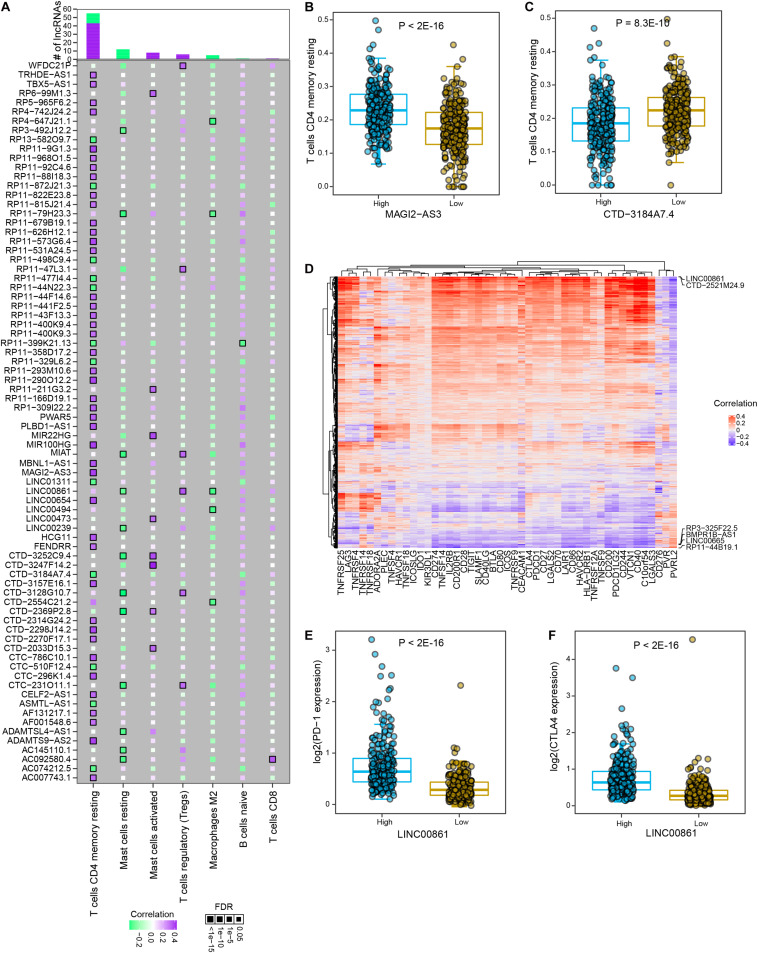
FIGURE 5.
The interactions between PRAD differential lncRNAs and major immune cells and immune checkpoint genes. (A) The correlations between significant differential lncRNAs and major immune cell types. Colors indicate correlation coefficients and diamond sizes represent FDR values. (B) Comparison of relative abundance of memory resting T cells between high and low expression levels of MAGI2-AS3 in PRAD samples. (C) Comparison of relative abundance of memory resting T cells between high and low expression levels of CTD-3184A7.4 in PRAD samples. (D) Heatmap shows the correlations between the expression of immune checkpoint genes and differential lncRNAs. (E) Comparison of PD-1 expression between high and low LINC00861 expression levels in PRAD samples. (F) Comparison of CTLA4 expression between high and low LINC00861 expression levels in PRAD samples.

