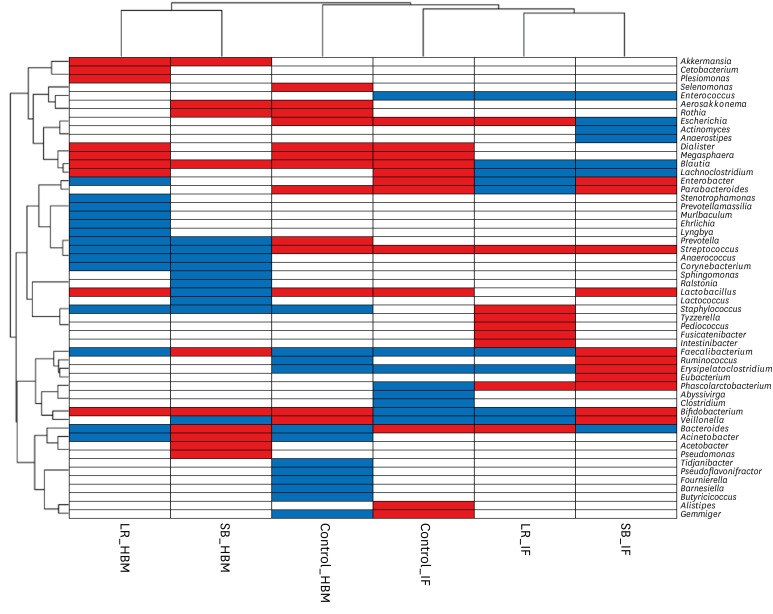
Fig. 4. Hierarchical clustering heat-map of genera that became more or less abundant under different experimental conditions. Microbial genera detected in the current study are shown along the y-axis. The experimental conditions are shown along the x-axis. Hierarchical clustering dendrograms are displayed on the left and top. Blue and red colors indicate a decrease or increase of a population in the microbiome, respectively, upon probiotic treatment.
HBM = human breast milk, IF = infant fecal, Control = the control group, LR = the L. rhamnosus group, SB = the S. boulardii group.

