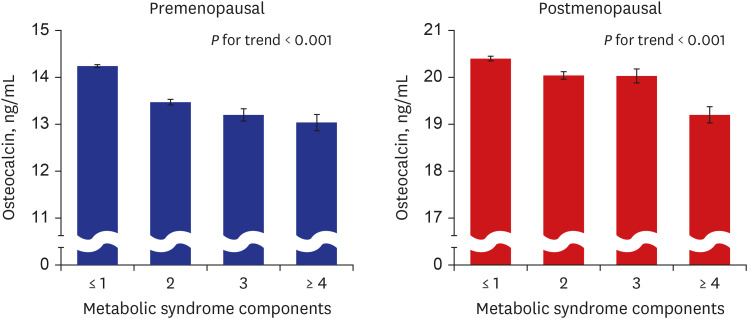
Fig. 2.
Serum osteocalcin levels in relation to the number of MetS components. Data were adjusted for age, BMI, ALP, UA, and hs-CRP, and are expressed as mean ± standard error. Multiple linear regression analysis was performed to determine the level of significant difference.
MetS = metabolic syndrome, BMI = body mass index, ALP = alkaline phosphatase, UA = uric acid, hs-CRP = high sensitivity-C-reactive protein.

