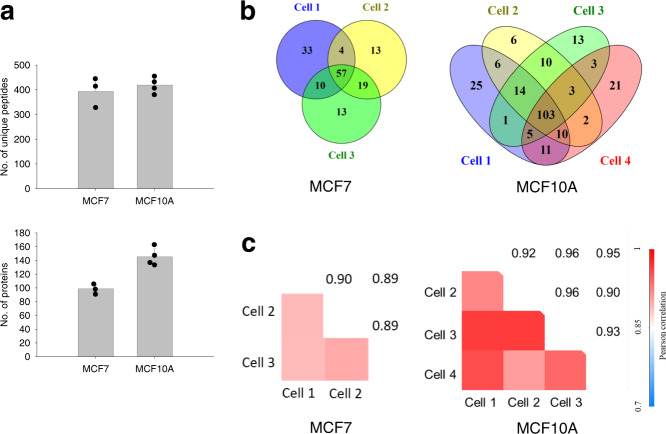
Fig. 4. Validation of SOP-MS for quantitative single-cell proteomics analysis.
a Number of unique peptides and protein groups identified by the MS/MS spectra alone from three single MCF7 cells and four single MCF10A cells (from newly cultured MCF10A cells) sorted by FACS. b Venn diagram showing the number of protein groups identified from each of single MCF7 or MCF10A cells. c Pairwise correlation of log10-transformed protein LFQ intensities between any two replicates from the three single MCF7 cells and the 4 single MCF10A cells. Pearson correlation coefficients were color coded as shown on the scale at the bottom. Half of the sample injection was used for the analysis of single MCF7 cells (i.e., 0.5 single MCF7 cells for MS analysis).

