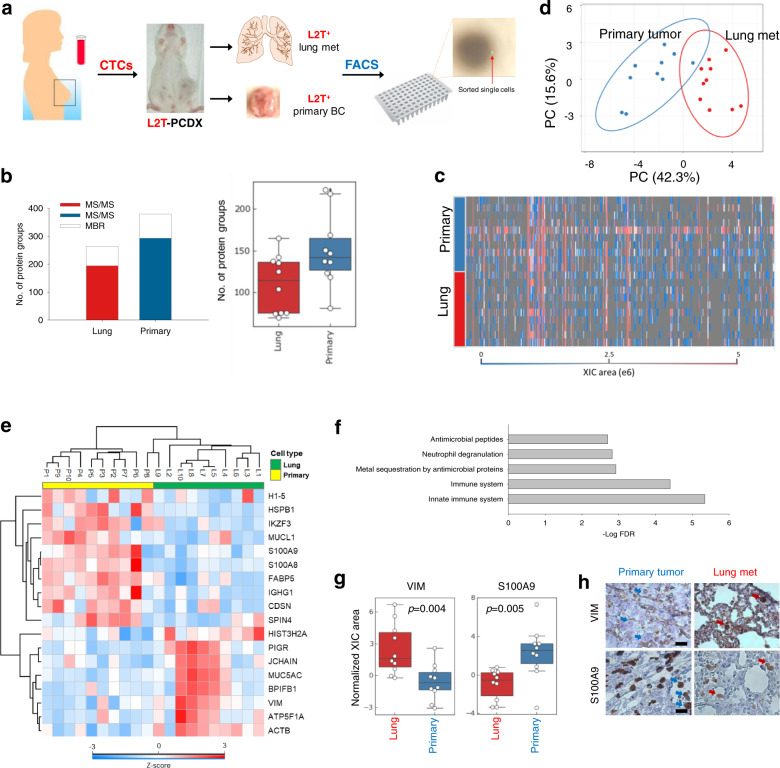
Fig. 5. SOP-MS analysis of single cells derived from a PCDX model.
a Schematic workflow of SOP-MS analysis of single cells derived from a PCDX model. CTCs from a breast cancer patient (NU-205) were isolated and implanted into NSG mouse mammary fat pads to generate the PCDX-205 mouse. The PCDX was verified (Supplementary Fig. 5) and transduced to express Luc2-tdTomato (L2T). Labeled primary PCDX and lungs were harvested for tissue dissociation and single-cell sorting. L2T+ single cells from the primary tumor and lung metastases were collected individually into single well of a 96-well PRC plate for SOP-MS analysis. b Total number of unique peptides and protein groups identified by the combined MS/MS and MBR across all 10 single lung metastatic cells or 10 single primary tumor cells, and the number of protein groups identified by the combined MS/MS and MBR for each single lung metastatic cells or single primary tumor cells. c Heatmap showing the total XIC peak area for each protein group identified by the MaxQuant MBR from either the 10 single primary tumor cells or the 10 single lung metastatic cells. d PCA analysis based on label-free quantification of proteins expressed in single cells from primary tumor and lung metastasis (10 single cells for each cell type). e Heatmap showing 18 differentially expressed proteins between single cells from primary tumor and lung metastasis. f Bar chart for pathway annotation. The bars represent the annotated pathways within proteins significantly expressed between two types of single cells. g Box plots showing the normalized expression levels of VIM (left) and S100A9 (right) between single lung metastatic cells and single primary tumor cells by using SOP-MS (10 single cells per cell type). h Immunohistochemistry (IHC) images of primary tumors and lung metastases, stained for VIM (top) and S100A9 (bottom). Arrows indicate representative, positive staining tumor cells. Scale bar = 50 µm.

