Figure 5.

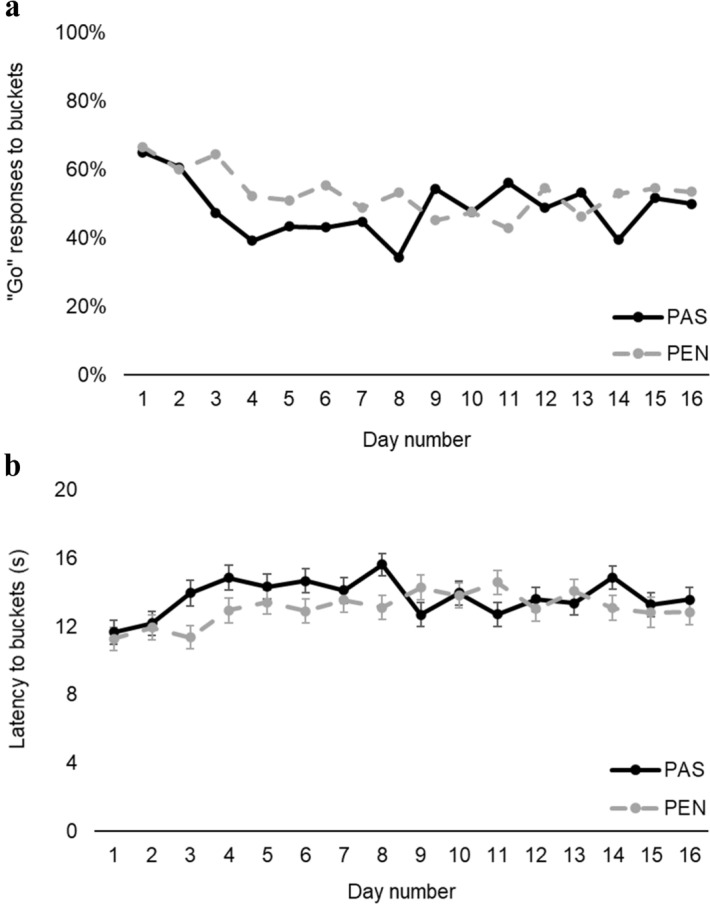
(a) Percentage of “Go” responses and (b) response latency to all buckets in each treatment (pasture access: PAS; cubicle housing: PEN) throughout the experiment (days 1–16). Error bars represent standard error of the mean.

(a) Percentage of “Go” responses and (b) response latency to all buckets in each treatment (pasture access: PAS; cubicle housing: PEN) throughout the experiment (days 1–16). Error bars represent standard error of the mean.