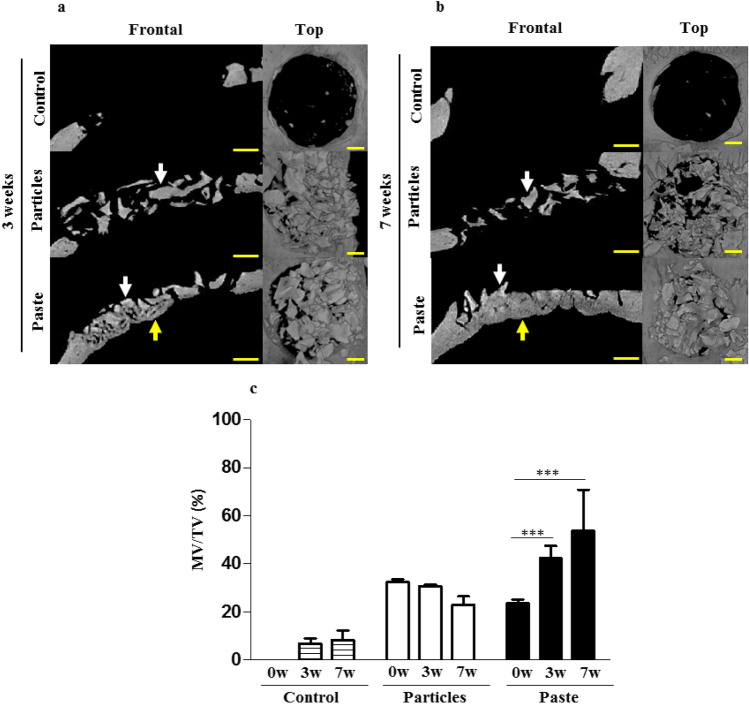
Figure 4.
Rat calvaria healing at 3 and 7 weeks after surgery in a critical size defect model. (a,b) Representative images of the reconstructed µ-CT acquisitions (yellow arrows: newly formed bone, white arrows: grafts). The control represents the unfilled defects. Scale bars: 1 mm. (c) Three-dimensional µ-CT quantitative analysis of the mineral volume (MV) within the tissue volume (TV) in the defects after 0 weeks (baseline), 3, and 7 weeks of regeneration. The results are expressed as means ± the SD (n = 6) **p < 0.01, ***p < 0.001).

