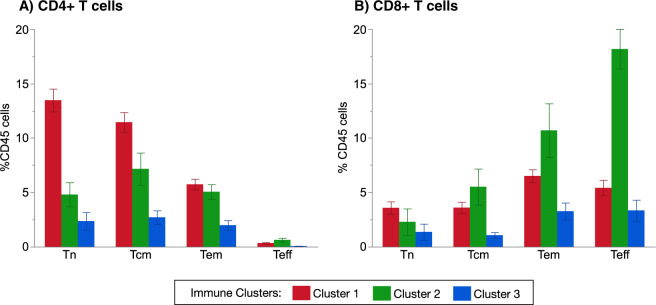
Fig. 4. Differential abundance of T-cell phenotypes within each patient cluster.
CD4+ T-cell subsets are shown in (A), with the percentages of Tn (naïve T cells, comprising subsets T1 and T2), Tcm (central memory T cells, comprising of subsets T6 and T8), Tem (effector memory T cells, comprising of subsets T4, T7, T9), and Teff (effector T cells, comprising of the T10 subset). CD8+ T-cell subsets are shown in (B), with the percentages of Tn (naive T cells, comprising subsets T11 and T12), Tcm (central memory T cells, comprising of subsets T13, T14, T15), Tem (effector memory T cells, comprising ofsubsets T17, T18), and Teff (effector T cells, comprising of the subsets T16, T19, T20). Results are presented as mean ± standard error

