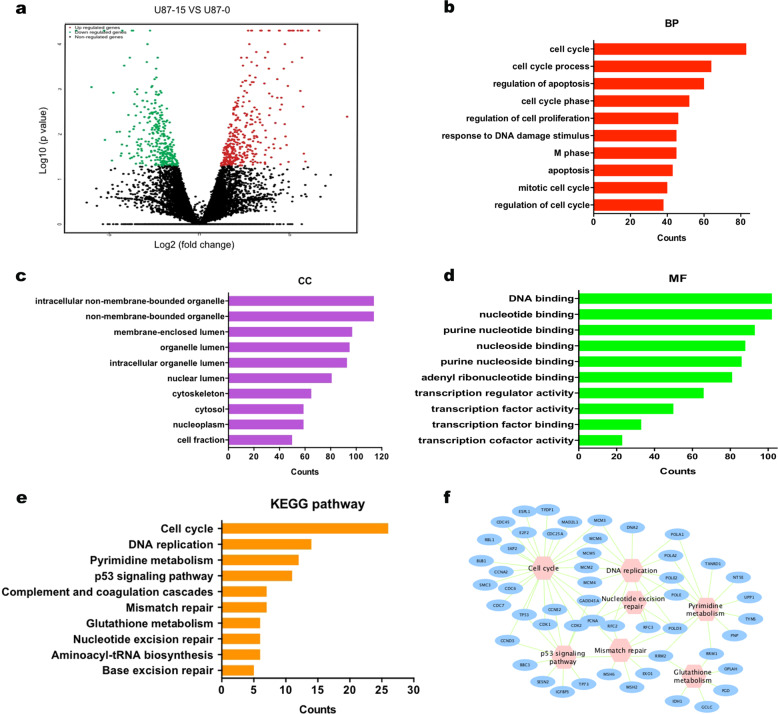
Fig. 5.
Differential expression and enrichment analysis of the U87 cells treated with avasimibe. a Volcano plot of differential expression results (upregulated genes are in red; downregulated genes are in blue; nonregulated genes are in black (|log2FC| ≥ 1 and P value ≤ 0.05). b–d GO enrichment analysis of differentially expressed genes. e, f KEGG pathway analysis of differentially expressed genes

