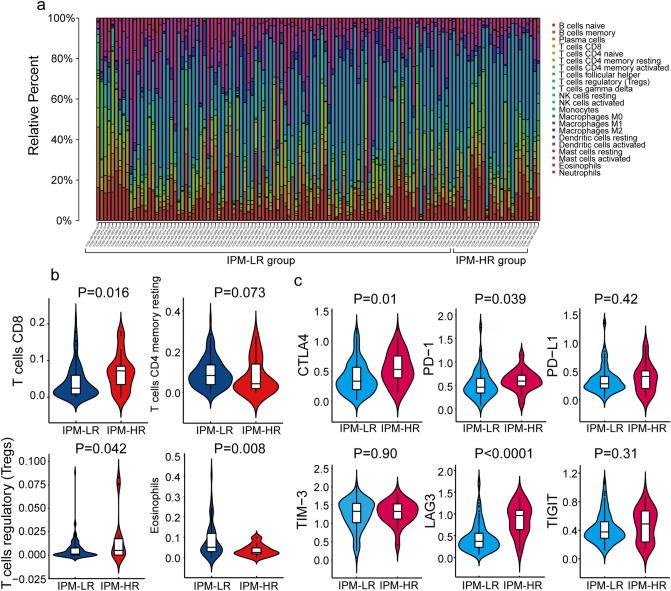
Figure 4.
Analysis of the immune cells infiltration landscapes and checkpoint molecules between IPM-HR and IPM-LR groups in non-M3 AML patients from the TCGA cohort: (a) Relative proportion of immune cells infiltration in IPM-HR and IPM-LR patients; (b) Violin plots showing significantly different proportions of immune cells between IPM-HR and IPM-LR patients; (c) Violin plots showing the expression of different immune checkpoint molecules between IPM-HR and IPM-LR patients.

