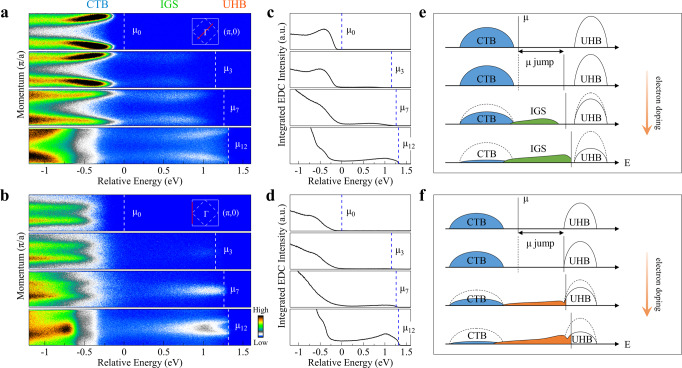
Fig. 5. Momentum-resolved electronic structure evolution picture of Ca3Cu2O4Cl2 with electron doping.
a Representative band structures at different electron doping levels, corresponding to Rb-deposition stages of 0, 3, 7, and 12, measured along the (−π/2, −π/2)–(π/2, π/2) nodal cut. b Corresponding band structures at different electron doping levels measured along the (−π, −π)–(−π, π) cut. The horizontal axes in (a) and (b) are plotted on a relative energy scale where the chemical potential position of the original undoped CCOC326 is set at zero, and the energy position of others is referenced to the chemical potential shift μ shown in Fig. 4d. The chemical potential positions for each doping are marked by white dashed lines. The corresponding momentum cuts for the bands are shown in the upper-right insets. c, d Doping evolution of the momentum-integrated EDCs which are obtained from (a) and (b), respectively, by integrating the spectral weight over the entire momentum range of the cuts shown as red lines in the insets of (a, b). e, f Schematic electronic structure evolution with electron doping along the (−π/2, −π/2)–(π/2, π/2) nodal direction, and along the (−π, −π)–(−π, π) zone face, respectively. The three spectral components, charge-transfer band (CTB), in-gap states (IGS), and upper Hubbard band (UHB), are also labeled on top of (a) for comparison.

