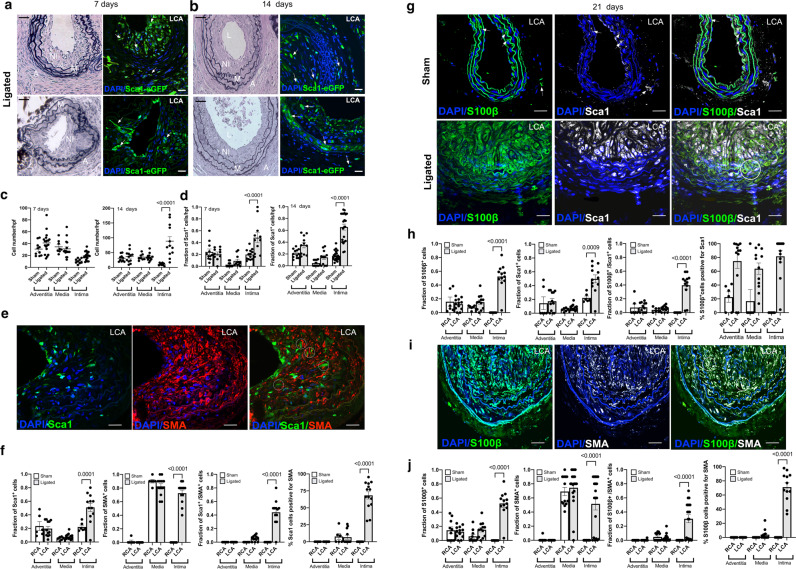
Fig. 2. Expression of Sca1-eGFP and S100β-eGFP cells following iatrogenic flow restriction after 7, 14, and 21 days.
a, b Representative Verhoeff-Van Gieson stained sections and corresponding confocal fluorescence images of DAPI nuclei (blue) and Sca1-eGFP (green) expression in LCA after a 7 days and b 14 days. Scale bar = 20 µm. c The number of DAPI nuclei/hpf in cross sections of adventitia, media and intima following partial ligation of the LCA after 7 and 14 days compared to sham controls. Data are the mean ± SEM of 3–5 representative images per animal, n = 4. d The fraction of Sca1 cells/high power field (hpf) in the adventitia, media, and intima of sham and ligated vessels after 7 days and 14 days. Data are the mean ± SEM of 10–15 sections from four animals per experimental group. e Representative confocal fluorescence images of DAPI nuclei (blue), immunofluorescence of anti-eGFP (green) expression and anti-SMA (Red) in the LCA 14 days post-ligation in Sca1-eGFP mice. Data are representative of five images per animal. f Cumulative analysis of Sca1+ cells, SMA+ cells, double stained Sca1/SMA-positive cells and the percentage of Sca1+ cells that were SMA1+ in the adventitial, medial and intimal layer of RCA and LCA vessels after 21 days, respectively. Data are the mean ± SEM, n = 15–20 sections from 5 animals. g Representative confocal fluorescence images of DAPI nuclei (blue), immunofluorescence of anti-eGFP (green) expression and anti-Sca1 (far red white) in sham and ligated LCA after 21 days in S100β-eGFP mice. Scale bar = 20 µm. h Cumulative analysis of S100β+ cells, Sca1+ cells, double stained Sca1/S100β positive cells and the percentage of S100β+ cells that were Sca1+ in the adventitial, medial and intimal layer of RCA and LCA vessels, respectively after 21 days in S100β-eGFP mice. Data are the mean ± SEM, n = 15–20 sections from 5 animals/group. i. Representative confocal fluorescence images of DAPI nuclei (blue), immunofluorescence of anti-eGFP (green) expression and anti-SMA (far red, white) in the RCA and LCA 21 days post-ligation in S100β-eGFP mice. Data are from a minimum of four animals per experimental group. Scale bar = 20 µm. j Cumulative analysis of S100β+ cells, SMA+ cells, double stained S100β/SMA-positive cells and the percentage of S100β+ cells that were SMA+ in the adventitial, medial and intimal layer of RCA and LCA vessels, respectively, after 21 days in S100β-eGFP mice. Data are the mean ± SEM, n = 15–20 sections from 4 animals/group.

